For the time being, given our national emergency, we are switching to DAILY COVID-19/China Virus threads instead of weekly threads. Your comments and updates are most welcome. PLEASE continue to post your valuable information, hard source links, and local observations within these Daily Threads. Additionally, we will try to include links to government and official pressers, so those who no longer have cable can remain informed.
We’ll get through this crisis, together. As a group, there is probably no one better prepared than we are.
For our newcomers: The Q Tree community has been diligent in covering the threat of Coronavirus, COVID19, Wuhan FLU. We started accumulating information about this virus in mid-late January, in what became almost weekly threads. We’ve been weeks, if not months, ahead of MSM outlets to vet rumors and other medical papers, etc.
Primary Update Links:
- Links to the USA CoronaVirus Task Force: http://coronavirus.gov/
- Johns Hopkins CSSE Dashboard to update number of “official” cases within China and worldwide: https://gisanddata.maps.arcgis.com/apps/opsdashboard/index.html#/bda7594740fd40299423467b48e9ecf6
- Another summary of data, updates and sources: https://www.worldometers.info/coronavirus/
- Hard Link to the World Health Organization: https://www.who.int/emergencies/diseases/novel-coronavirus-2019
- Hard Link to the Center for Disease Control: CDC Updates: https://www.cdc.gov/coronavirus/index.html
In our past weekly threads, we assembled information on the following:
- Primary update links. The dashboard from Johns Hopkins which counts “official” cases all over the world, the CDC, and WHO, and includes the links for our past threads.
- Hard Data Medical Information- Explanation about testing, reliance on China for drugs, analysis of NE Journal of Medicine results and other published papers.
- Vaccine and theraputics (new/old drugs to alleviate symptoms) news and updates
- Trump Administration response (the timeline and links to various agencies)
- China Responses, timelines, research, attempt to cover actions, or secrecy in results discovered.
- An aggregate of info/responses from other countries, listed by country.
- Economic impact from around the world. A change in economic activity will indicate a “return to normal”.
- Speculation/debunking on how the virus started
- Media Bias, political response, and debunking section, like the article from AP News, overt bias from Politico, inflammatory headlines, etc.
- Other medical info to boost immune system, herbal remedies, ways to keep your house clean and NOT spread the virus to others. Excellent information to incorporate into daily lifestyle.
- Hard links for OTHER valuable sources/blogs and a brief sentence or two about what they provide
- Other news items
Our weekly updates. timelines, collection of valuable information, can be found here:
- January 25th, Our first thread: https://wqth.wordpress.com/2020/01/25/20200125-coronavirus/
- January 27th, Our second thread: https://wqth.wordpress.com/2020/01/27/20200127-coronavirus-update-thread/
- February 1st-9th, Our third thread: https://wqth.wordpress.com/2020/02/01/20200201-coronavirus-update-thread-3/
- February 10th – 18th, Our Fourth Thread: https://wqth.wordpress.com/2020/02/10/20200210th-19th-coronavirus-thread/
- February 19-29th: Our Fifth Thread: https://wqth.wordpress.com/2020/02/18/20200218th-29th-coronavirus-update-thread/
- March 1-10th, Our Sixth Thread: https://wqth.wordpress.com/2020/03/01/2020-march1st-7th-coronavirus-covid19-xivirus-wuflu-6th-update-thread/
- March 9-16th, Our Seventh Thread: https://wqth.wordpress.com/2020/03/09/2020-march-9th-16th-coronavirus-covid19-xivirus-wuflu-7th-weekly-update-thread/
Please try to keep your sense of humor during this National Emergency, and remember, patience is a virtue.
Love to all!


Obama’s high water mark – I love it!!!
love that one
You are rockin’ the memes, Daughn 😃😅 I wish POTUS would do that to NYTimes & WaPoo
WaPoo is sticking to the bowl for this boy!!!
😷😷😄😬😅
TP menorah lol loved all three of them!
TP currency
the memes have been wonderful
Sometimes the best medicine is laughter
So after 1 TP roll for 8 days and 8 nights what than? Use the nyt?
By then, you have been blessed with eight more toilet rolls.
That’s how I read it, anyway. 🙂
GasBuddy: Gas Price Map
USA National Gas Station Price Heat Map
https://www.gasbuddy.com/GasPriceMap
“We’re meeting right now, and I think they’ll work something out. And if they don’t, I think I know what to do to solve it” – VSGPOTUSDJT
Meeting with Oil Companies and Producers on Friday
https://twitter.com/BenKTallmadge/status/1245568590260011009
Betcha they are. And the terms for this aid are “we got extra gowns and masks. We’ll flip those to you now. When you have extra stuff we need, we’d appreciate a backatcha.” Meaning it could be Ford ventilators or hydroxychloroquine when we’re pumping out buckets of the stuff….
Hey, we can “repay” Vladimir by giving him a “special care package” A direct military flight to Moscow, containing one SPECIAL passenger. Soros. I bet Vlad would quadruple his aid then. Hell Vlad might throw in PROOF that the Russia hoax was NOT them.
Don’t forget his sprouts. They are as rotten as he is and just as guilty.
True!
And still young enough to continue to destroy all in their path…😡🤬
In case it hasn’t been posted yet: this “coronavirus patient” in NYC is wearing a cabal ring:
That hospital tent is teeming with hordes of sick New Yorkers. I hope they’re not all maxed out like this one is.
It’s like we’re being intentionally pranked.
It’s like they’re preparing for Woodstock, and only Joe Biden’s supporter showed up. 😂
Pretty soon the Samaritan’s Purse crew is going to wonder what they even showed up for.
Note that the hospital is Mount Sinai. From what I can tell that is a cabal outpost. It might be a signal of some sort.
Where is the photo of the patient wearing a ring?? All I see is other people, but not the patient??
I am getting weary of CTs, numerology and far out mystic/surrealistic/science fiction prognostications from those allegedly on our side.
Remember gnostic is right in the middle of prognostication. It’s faux religion, faux prophecy and faux truth.
“Where is the photo of the patient wearing a ring?? All I see is other people, but not the patient??”
______________
The patient’s hand with the ring is just outside the photo. The patient is under the blue blanket, with the doctor wearing the bright blue-green surgical mask attending to him.
If you click on the photo it takes you to the original Twitter photo, which is larger, and you can see the patient’s hand and the ring. Click on the photo at Twitter and it enlarges further. It’s the same ring as all the other Cabal members seem to wear.
Which, of course, is bizarre and not a coincidence.
(Thanks trumpismine for the great open today!)
American Greatness is Coming Back in a Big Way!!!
This is our moment to come together, to show our enemies, to show the world, and for all time . . .
Though they thought they could defeat us . . .
WE WILL MAKE AMERICA GREAT AGAIN!!!
Great moments are born from great opportunity.

And that’s what you have here tonight, boys.
That’s what you’ve earned here, tonight.
One game.
If we played ’em ten times, they might win nine.
But not this game. Not tonight.
Tonight, we skate with ’em.
Tonight, we stay with ’em, and we shut them down because we can!
Tonight, we are the greatest hockey team in the world.
You were born to be hockey players — every one of ya.
And you were meant to be here tonight.
This is your time.
Their time — is done. It’s over.
I’m sick and tired of hearin’ about what a great hockey team the Soviets have.
Screw ’em!
This is your time!!
Now go out there and take it!
Lol. Tp menorah…aw man. And you know what? The best TP is Scott tp cause its lasting forever.
It’s the best for septic systems too, or so I’ve heard. 😀
https://wearethene.ws/notable/94146
Post 8653523 7 hours ago • View on 8kun
https://www.washingtonexaminer.com/news/fbi-warned-about-biosecurity-risk-after-chinese-nationals-snuck-suspicious-vials-into-us
FBI warned about ‘biosecurity risk’ after Chinese nationals snuck suspicious vials into US
by Jerry Dunleavy
| April 01, 2020 06:21 PM
An intelligence bulletin from the FBI late last year warned of a growing “biosecurity” threat within the United States after Chinese nationals were caught attempting to sneak potentially dangerous viruses into the country by plane.
The “tactical intelligence report” from the FBI’s Weapons of Mass Destruction Directorate assessed in November that “foreign scientific researchers who transport undeclared and undocumented biological materials into the U.S. in personal carry-on and/or checked luggage almost certainly present U.S. biosecurity and biosafety risks,” according to the unclassified document obtained by Yahoo News.
Even when these samples were declared, investigators warned, “It is impossible to determine, without testing, the validity of the contents of the samples and if they pose a risk to U.S. human, animal, or plant populations.”
The bureau’s Chemical and Biological Intelligence Unit pointed to at least three separate instances in 2018 and 2019 where Chinese nationals tried to bring undeclared samples of bacteria and viruses, some of them potentially highly dangerous, into the U.S. All of the failed attempts were stopped by Customs and Border Protection at Detroit Metropolitan Airport.
One of the incidents took place a couple months before the coronavirus outbreak first appeared in Wuhan, China. The U.S. intelligence community believes the Chinese lied about the severity of the COVID-19 outbreak for months and to this day is covering up the real number of cases and deaths in China.
Last year’s FBI report said in September that a Chinese national was stopped after he “initially made no positive declarations, but was later found to have eight vials of clear liquid in their checked luggage.” The bureau noted that “the vials had no supporting documentation.” The Chinese national claimed that it was “DNA … derived from a low-pathogenicity strain of H9N2,” which was a flu-type virus that killed a small number in Asia. But some vials had “WSN” handwritten on top, an acronym for the H1N1 influenza virus commonly known as swine flu, which killed over 12,000 in the U.S. and more globally. The bureau said that “the materials were confiscated” and that the unnamed person was allowed to travel to Texas “to work with a researcher associated with” an unnamed “U.S. research institution.”
The bureau advisory also recounted how, in November 2018, another Chinese national was found with three vials labeled “antibodies” in his luggage. The person identified himself as a “biologist” but “had not declared the materials” and “did not have appropriate documentation for the items.” The Chinese national said that “the items came from a researcher in China who asked him to deliver them to another colleague,” again at an unnamed “U.S. research institution.” The writing on the vials combined with their destination led U.S. officials to believe the vials might contain “viable” specimens of Middle East respiratory syndrome and severe acute respiratory syndrome viruses. MERS has killed just under one thousand people worldwide since 2012, and SARS killed just under 800 globally between 2002 and 2004.
FBI investigators further noted that, in May 2018, a Chinese national was stopped. This person claimed to be “a breast cancer researcher in Texas” who “was not traveling with any biological products.” But, upon further inspection, the person admitted to be “possibly traveling with plasmids,” a type of extrachromosomal DNA. He was found to have one “centrifuge tube” in his checked bag, saying it was “non-infectious E. Coli bacteria-derived plasmids.” The bureau said the Chinese national was “unable to provide any accompanying documentation or permits,” so the U.S. officials put the centrifuge on an “agricultural hold” and let him go.
The U.S. government’s concerns about Chinese research in the U.S. have grown recently.
Good grief, if that’s what’s being brought in via commercial flights, imagine what’s in the diplomatic pouches!!
That’s one “tradition” I think should be removed…diplomatic pouches should be inspected…period.
Not sure when or how it began, but obviously greatly abused at this point….and undoubtedly dangerous.
And I remember when they made me throw out my liquid shampoo…
They are consistant. Everybody gets let go after they take your contraband.
The Chinese, in conjunction with scientific/academic traitors in the USA, are waging war on us. Please God, help us to root out the enemy, foreign and domestic, and keep our people safe! Amen.
Not every biological researcher who lead a lab is American born. My son worked for two one Indian a a University and one Pakistani who owned a lab. They treat American researchers like slaves.
Researchers are alway searching for money to keep their labs going and the staff researches are paid little because of money crunch.
Something has to change if we are going to promote PhD who are American born and not make them compete with Chinese, Russian Middle eastern who never take vacation and work 18 hour days 7 days a week. Many good American researchers burn out or do not get a job after their education. My son has friends who never got a position and some killed themselves and saw themselves as failures.
This is horrible. May globalism die a thousand deaths!!!!
AMEN.
“The bureau’s Chemical and Biological Intelligence Unit pointed to at least three separate instances in 2018 and 2019 where Chinese nationals tried to bring undeclared samples of bacteria and viruses, some of them potentially highly dangerous, into the U.S. All of the failed attempts were stopped by Customs and Border Protection at Detroit Metropolitan Airport.”
What is the Real reason for the Detroit connection?
Interesting question!
https://wearethene.ws/notable/94141
Post 8653657 7 hours ago • View on 8kun
Israel’s MDA to treat coronavirus patients with new ‘passive vaccine’
This assumes that those who have recovered from COVID-19 have developed special anti-virus proteins or antibodies in their plasma, which could therefore help sick patients cope with the disease.
The first patient who recovered from coronavirus donated plasma on Wednesday that will be used to create a “passive vaccine” to treat Israelis who are severely ill with COVID-19, according to Magen David Adom deputy director-general of blood services Prof. Eilat Shinar.
This assumes that those who have recovered from the disease have developed special antivirus proteins or antibodies in their plasma, which could therefore help sick patients cope with it.
“When people are exposed to any disease, they develop antibodies,” Shinar explained.
Passive immunization is when you get those preformed antibodies. An active vaccine, in contrast, is when you are injected with a dead or weakened version of a virus that tricks your immune system into thinking that you’ve had the disease and your immune system creates antibodies to protect you.
In the first phase, plasma will be frozen and then delivered to hospitals across the country for patients to be treated by transfusion, Shinar said. In the second phase, the goal is to collect enough plasma to prepare antibody (immunoglobulin) concentrate with which patients will be treated later.
Shinar said the Health Ministry is currently in discussion with two companies that can create the immunoglobulin and is writing a protocol for who can receive the treatment.
MDA has been collecting plasma for more than 30 years; thousands of volunteers donate blood this way every day. Plasma with antibodies was used to treat patients with SARS during the outbreak in 2002. In addition, Israel offered a similar treatment to patients with West Nile fever.
Last week, Shinar said, the FDA approved a similar protocol in the US.
Earlier this week, The Journal of the American Medical Association published an article about plasma being used to treat five COVID-19 patients in China, which said that it “very much helped in their recovery,” Shinar said.
Before being able to donate plasma, a patient must wait 14 days from the time he or she was confirmed negative for coronavirus via two separate swab tests – hence the reason the first plasma was donated only on April 1. Shinar said that there should be another batch of donors available after Passover – those who were infected over the Purim holiday.
MDA will invite the potential donors to its Pheresis Unit at MDA’s Blood Services Center at Sheba Medical Center, Tel Hashomer. Shinar said that if there are enough donors from a particular city, however, MDA could set up a center there. Donors can also offer to donate on their own by calling 03-530-0445.
Plasma can be given as much as twice a month.
MDA director-general Eli Bin said his organization is at the forefront of the fight against the coronavirus in Israel, and with this new treatment and others being tested in Israel and around the world, “we all hope that together we will overcome this challenge.”
https://www.jpost.com/HEALTH-SCIENCE/Israels-MDA-to-treat-coronavirus-patients-with-new-passive-vaccine-623172
Read they’ve started at least some part of this at hospital in Ft. Worth.
Some of the usual pundits must be needing more clickbait – are selling the idea that massive inflation is around the corner. . .
Credit Crisis Averted… Monetary Crisis Initiated
https://www.zerohedge.com/markets/credit-crisis-averted-monetary-crisis-initiated
There’s always a promotion of buying gold with inflationary panic around the time of economic uncertainty. You can bank on it – because someone is and making a killing when the gold prices spike.
Some modest inflation does not scare me. The dollar amounts that they are talking about pumping into the economy sound enormous, but they are only a small percentage of the total GDP pie.
Keep in mind that other nations around the world are CHEATING. They have negative interest rates. In effect we are importing deflation.
We have an incredibly strong dollar. But it is too strong against other currencies, which is making trade harder. Meanwhile, the dollar keeps getting stronger and stronger – what we are not seeing is that the dollar is STABLE against other currencies.
Despite all the chicken little’s declaring the inflationary sky is falling, there is little to no evidence to support any of the doomsday scenarios. IMO, the economic shutdown scenario risks significant deflationary pressure. It’s never particularly popular to talk about the destructive consequences of deflation on the poor.
Those are just my thoughts, I am not an economist or an expert on these matters, but the idea that a small marginal increase in the total money supply proportional to the GDP is going to send us into hyperinflation is paranoid hyperbole.
You have it correct when you say we are importing deflation. For decades, we have inflated our currency to help the rest of the world’s economies……but that don’t play in MAGA times.
And everyone with eyes to see knows the Euro is about to fracture.
Yesterday there was a post with Dr. Shiva’s recommendations for supplementation. I’m not going to say those recommendations are wrong, but it seems wise to take a step back here.
Think about it.
Unlike other doctors THAT ARE TREATING COVID-19 PATIENTS he is simply giving his idea of good supplementation. No patient data. What if Vit A is typically good but for some reason in COVID-19 it’s very bad?
Also, He is happily drawing attention to himself and his superior knowledge, soundinig like a “Trump should do this” mentality. This always is a big flag for me.
Yes, he may be absolutely right and have great ideas, but something is off at least a little bit. However, in my years I have read book after book that had “the answer” given by a doctor with “success” in something but how they said things worked just did not agree with experience of other doctors looking at their work. But they sold books and booked lots of appointments.
I prefer to listen to doctors that have experience treating patients with similar diseases,
like Dr. Klinghardt who has treated MERS, even MERSA and now COVID-19 patients.
https://klinghardtinstitute.com/wp-content/uploads/2020/03/Dr-Klinghardt-Corona-2020-slides-9-march-2020.pdf
https://www.youtube.com/watch?v=yIL2FVlaZu4
I do completely agree with Dr. Shiva’s assessment of how broken medical science BTW.
Yeah, I’m a bit side-eye on his recommendation of vitamin A without clinical proof, because I’ve actually experienced hypervitaminosis A, and it’s annoying. And I also need COVID-19 specific evidence with real patients. Raoult’s work with HCQ/AZM was real. Chinese work with Vitamin C is suspect, but vitamin C in 500-1000 mg/day pulled ME through it, with some damage, so I’m OK with the idea as maybe proven.
Is there clinical evidence that vitamin A works against COVID-19?
You’ve experienced hypervitaminosis A? Did that involve seafood?
I supplement my beta carotene intake. If you take too much, you turn orange (harmlessly). It is converted in your body to vitamin A as your body determines necessary — if you need none, it converts none.
Supplements!
ZINC…and D3…and, of course, lots of C
I’ve not researched it but I do recall many anti-vaxx doctors saying low Vit A status is what makes children more vulnerable to poor outcomes with measles, rubella, etc.
Should be able to search on those types of terms and pull up what they are basing this on.
Wolfie asks: “Is there clinical evidence that vitamin A works against COVID-19?”
….
Journal of Medical Virology
Potential interventions for novel coronavirus in China: A systematic review
It names several vitamins and supplements. This is the section for vitamin A.
Totally fine with it. No issues at all with Vitamin A.The key is to not take beyond what is recommended. I take it for different reasons than for the cuomovirus.
Like with all these people that get posted here, it has to settle in your mind in a believable way. If not, don’t listen. It does not mean it can’t help other people. Often times, experts in the exact same area disagree with one another. So it tells me it is just a point of view. Perhaps one is more informed than the other but that then falls on our judgment.
I have macula degeneration and take meds with high dose of Vitamin A.
Occasionally I take myself off just to cleanse my body.
Proves again every…body is different. Note…that’s not the same as saying everybody is different.
We all react/respond in different ways because of what our body needs …or not.
My current doctor prescribed a (very expensive) progesterone for better sleep and rest…well, it appears it made my blood pressure skyrocket. Haven’t been back yet nor reported it, but immediately took myself off and continue to monitor before calling him to see if that’s the culprit.
I’m confident we will tweak and work it out, but it’s just an example that one size doesn’t fit all.
That is a great comment. Agree 100%
Same way with the food regimens folks recommend. Every Body is different.
You might want to look into Wellspring’s Serenity bio-identical progesterone. I have found it very effective but don’t have blood pressure issues.
Thanks…doctor is very much into the bio-identical hormones…this is probably one of them. I never had BP issues, either!
Ironically, took bio -Idents for years then the head of the Medical School’s OB/GYN department switched me because Bios “couldn’t be properly measured”. Now I have a huge supply of those @$8 a pill and say to this doc I’m using them first!
I agree with what you are saying. I’m not really flagging his recommendations as concerning as saying he seems to be short on experience with TREATING THIS VIRUS and has more self-promotion than I generally see in a doctor humbled by treating more difficult cases.
He’s a pretty bright guy. I listen and take in what I think works for me. There are some videos where he explains how the covid cells attach to regular cells which I found helpful in understanding the virus.
I will wear a mask when Senators Michael Bennet and Pat Toomey start wearing masks. No more double standards for politicians!
“Today, @SenToomey and I are calling on @CDCgov to advise Americans to wear homemade masks when they have to leave the house.”
_______________
Homemade masks?
Like we did when we were kids on Halloween, and couldn’t afford real ones?
Who is this guy? 😂
What’s wrong with a regular commercially produced mask?
Or are those only for you important government types?
Antifa was ahead of its time.
OMG, I’m laughing my butt off!
They trying to make it difficult to tell who is who when the “protests” inevitably start? 🤔🤷
Especially if they all wear hazmat suits and surgical gloves.
Agreed. Best way to play this is ask points of commerce to make a face covering mandatory to conduct commerce. ie shop. But only in places where spread is likely. No need to wear one when your away from points of congregation.
Of course dems will make this as painful as possible and will be checking to see if your wearing one while in the bed room fast asleep. That said, not all people coming into your bed room at night while the lights are out are from the government so it might be a good idea to establish a running password. 😎
Did anyone else notice that a psychopath actually derailed a train to try to attack the USNS Mercy in Los Angeles Harbor?
https://townhall.com/tipsheet/bronsonstocking/2020/04/01/man-arrested-after-derailing-train-to-attack-usns-mercy-hospital-ship-docked-in-los-angeles-n2566182
The MK-DEM party used a truck on a train. Might as well try a train on a boat! 😉
Don’t forget a plane on a building…..
Oh, I am SO PISSED at Adam Schiff, MONSTER CHI-COM COLLABORATOR, for asking to hold cover-up hearings, it ain’t funny.
He wants to have “hearings” now? While he’s in POWER to cover up his own role?
OH, BURN THAT BASTARD NOW.
That’s it, I’m done. His fucking impeachment scam was TIMED to work with the freaking Chinese biological attack, and that whole nest of TRAITORS needs to be THROWN IN THE FIRE AND BURNED TO NOTHING.
Gosh, Wolfie, don’t hold back…how do you REALLY feel? 😉
ADAM SCHIFF’S AN ASSHOE
F U ADAM SCHITT
STFU ADAM SHITHEAD
GO WET KISS PELOSI, YOU POS SCHIFF
feel much better now 😀
“AMEN”!!! 😀
Here is some more pro-mask out there:
https://twitter.com/neuro7plastic/status/1245602566383140865
https://twitter.com/neuro7plastic/status/1245603007510675456
https://twitter.com/neuro7plastic/status/1245603147709419524
https://twitter.com/neuro7plastic/status/1245607074752385030
Even did a bit of window shopping!
“Limited data suggest that *cloth masks protect against droplet transmission better than no barrier.*”
________________
Ya think?
I love how they pretend like this is some kind of new discovery… 😂
This just in… after decades of research, scientists and medical professionals around the globe reveal that cloth masks protect better than no barrier at all.
Surgeons and their assistants to begin wearing masks pronto, Trapper John.
When reached for comment, several surgeons commented, saying ‘We never knew… if only we had known… this is gonna save lives…” 👍 😁
I’m beginning to suspect we may be trapped inside a planet-sized farce.
https://en.wikipedia.org/wiki/The_Truman_Show
Anything to keep this going, really.
Is it possible that the ‘asymptomatic’ people are really ‘presymptomatic’? Or, is there truly evidence to suggest that there are a million Typhoid Marys out there.
And how does this differ from a usual flu season as far as asymptomatic people spreading it?
One more thing. I think there is something going on behind the scenes. My sense from yesterday’s presser, is that there is something else they want to hit us with, and our President is using the pandemic to keep us safe. So, if this continual “news” coming out with this and that study to suggest this or that, then I’m okay with the way things are right now.
Trust The Plan. It very likely includes stuff we have no idea about – YET.
Roger that, Wolf.
“Trust The Plan.”
______________
What is the plan?
We don’t know, so apparently our plan, our part in this farce, is to Trust the Planners.
So why didn’t they just call it that in the first place? 😂
WE ARE, instituted by BILL FREAKIN GATES. Cuomo of ALL people gave up the SOURCE of ALL the projections used to start and FEED this farce IHME, IE BILL GATES. The SAME exact scenario his conference MOCKED less than a couple months ago. That is WAAY to convenient. NO WAY that happens the odds are greater of being hit by a rock from Venus and killed. IE infinitesimal.
I noticed the trend a couple days ago. There’s something more going on than just wanting to stymie disease transmission, especially going into spring and summer.
“I noticed the trend a couple days ago. There’s something more going on than just wanting to stymie disease transmission, especially going into spring and summer.”
_____________
Agreed. Something for which it is beneficial to the population to be as dispersed as possible, indoors as much as possible, and definitely no large crowds.
The Chinese virus provided a plausible reason to do all of those things, and may actually be the primary reason, but by extending the ‘isolation behavior’ to May (or beyond), is it to protect against some other false flag waiting in the wings, and about which the administration knows is coming?
What other kind of attack by the Cabal would be well defended against by having the majority of the population ‘sheltering in place’?
Look who DEFINES chutzpah. AGAIN.
I am just so sick of these fucking communists. So sick.
THEY GIVE ME THE WILL TO LIVE, TO SEE THEM ALL DESTROYED.
What if …
Schiff-for-brains is being allowed to do this in hope that somebody feels threatened enough to whack him? Whether the effort is successful or not, the deepstate proceeds to blame it on deplorables regardless of truth about it.
I doubt that Schitt is smart enough or talented enough to perform like he has been. His ‘ability’ to wiggle out of every fact conflict is simply beyond my suspend-disbelief ability to accept.
But no matter what is the truth, he is 100% a completely depraved human being. He doesn’t even have the decency to divorce; preferring to make his spouse wear his coat of disgrace.
I won’t rest until that traitor has faced JUSTICE. My lungs are scarred by that bastard’s evil hand, and I will haunt him into an early grave with me – only MY JUSTICE WILL HAVE THE PURITY OF THE LAW HE DISREGARDS AND DARES TO CORRUPT.
They want to be on the front lines then by all means, lets put Accosta and the rest IN a Contagious ward WITHOUT ANY EQUIPMENT for 48 hours….
Anybody thinking what I’m thinking?
We’re in the 4th year of the Trump presidency. Solomon didn’t mention that.
I’ve thought the same thing – no one told POTUS about this issue. Looking at the bureaucratic, bean counter type people who essentially have to become political animals first, and scientists and doctors second in order to survive.
We often see the same situation in the military – the higher up one goes, the more you’re there because of politics, not necessarily because of talent. It’s why Obama did those military purges…
“Don’t step on the hard backup plan.”
Run-up to 2020…
I’m trying not to go there, what you’re thinking.
SIXTEEN YEAR PLAN.
That’s NOT where I was going with it.
Probably a different theory. I’ve got multiple hands in these cards!!!
Even if this was not a planned released of the virus, Obama and his commie cohorts always had a negative view of sustaining human lives – except for their own. Everyone remembers the give grandma a blue pill – for “pain” instead of a pacemaker – despite the fact that grandma was active and enjoying life.
This connects to their pathological demand for abortions – having nothing to do with the alleged well-being of the mother, but everything to do with the power over life and death.
Abortionists essentially enjoy this work – they enjoy killing. Almost the perfect example of a psychopath. The Leftists in Congress hide these secret supplications of the heart – that’s why they’ve signed on to the radical agenda of the globalists/communists..
These people are Nazis. They have no value for human life – Obama simply intended to restructure society so that everyone would accept going quietly to their deaths. Leftist politicians and the Malignant Media expect to be in the Chosen Few group. It fits their insatiable need for POWER.
I do make a distinction regarding modern day Russia – while communistic, Putin is very nationalistic, pro Russian Church, and he isn’t interested in killing babies. A different type of communist philosophy exists there.
I do not believe Putin was ever a “real” communist. IMO he mimicked one convincingly enough to rise within the Party but I really see no evidence today that he possesses any affinity/yearning for the rigidity of the commie bureaucracy of old.
Again IMO the way to politically rise in Russia today is to demonstrate nationalistic devotion to the concept of Russia as geographically entitled to influence world affairs and therefore devotion to the notion of Russia superiority (this also requires devotion to Putin personally). Putin seems to believe that if put to a vote, most bordering countries would choose to be part of a Russian Alliance (e.g., Crimea) and that the reason this task is difficult is because of the heavy-handed excesses of the Soviet Union being still fresh in the minds of many formerly subjugated people.
Russia and China will always be regional leaders and world players at a minimum. That is why WHO IS LEADING THEM MATTERS. Spreaders of evil will cause trouble for the world.
All Obama certainly seemed to personal select the drone victims, if reports are correct. I guess vague “policies” that might not come into fruition until Hillary was in Office wasn’t’ satisfying.
Red pill for today:
What if the FDA is requiring a positive COVID-19 test and hospitalization of the patient BEFORE the MD can prescribe the medicine combo, because if the MD treated based on symptoms as an outpatient and the test came back NEGATIVE it proves the combo works on other viruses like para-influenza. There would not be a need for the flu shot. That money dries up.
Therapeutics
On March 28, 2020, FDA issued an EUA to allow hydroxychloroquine sulfate and chloroquine phosphate products donated to the Strategic National Stockpile (SNS) to be distributed and used for certain hospitalized patients with COVID-19. These drugs will be distributed from the SNS to states for doctors to prescribe to adolescent and adult patients hospitalized with COVID-19, as appropriate, when a clinical trial is not available or feasible.
Well, thankfully our Sylvia got the meds and she was not hospitalized. Are you saying doctors are prohibited from prescribing it UNLESS the patient is an in-patient? That is absurd if FDA put that restriction on it.
Absolutely it would be absurd to wait for hospitalization. In fact, if anybody is suggesting that, then TRUMP SHOULD FIRE THEM.
That’s like saying “wait for the fire to get to 4 alarms before sending anybody”. Ridiculous.
Zelenko’s CLINICAL EVIDENCE (and it don’t have to be no fuckin’ double-blind controlled study for THIS scientist to see the error bars) is that this stuff is most useful immediately.
What POTUS is saying at the pressers, and what FDA + state level Dept of Health are doing, do not match up. Apparently, FDA is not listening to the POTUS pressers, and the states are “following FDA guidlines”.
Gonna have to keep pushing then. Time to make people RESPONSIBLE for not moving hydroxychloroquine to the FRONT LINES.
Yes, that is the FDA guidline, and many states Dept of Health have HCQ on lockdown, snd will not re-supply pharmacies.
Understandable if supplies are an issue. But they better clarify that pretty damn fast!
Please share what you are thinking for discussion.
I think that depleting the stockpile and not replenishing it may well have been on somebody’s anti-American “to-do” list. At a minimum, the Boy Scout motto of “Be Prepared” is just HATED by the socialists. It’s almost reflexive training to hate certain ideas, and to rebel against them. Their DISDAIN for “preppers” is really cultural – grasshopper lifestyle vs. ant thinking. All very Luciferian in rebelliousness.
So it may have been mediated through Obama’s contempt for preparation, and his cunning, stealthy, depletion of American preparedness. OR there may have been specific instructions “not to replenish”, which would have been on the EXTREME down-low (as in whispered over golf).
I tend to think that Obama was much more in cahoots with China than people realized, and that it was covered up by a combination of Obama appearing to ignore China, and China appearing to disrespect Obama. “No cover like reality.”
So people know, this is Rich Higgins’ group.
Oh, wow. The man who spotted the red-green axis against Trump long before the pustule of THE SQUAD appeared.
In retrospect, the guy had a freakin crystal ball. I pay attention to his opinions. The guy has superior instincts.
Yup. And that’s why they got McDupester to deep-six Higgins.
I would LOVE to know how McMaster was influenced to take Higgins out. Gotta be classic Obama holdover bad influence, IMO.
https://twitter.com/GKeile/status/1245548759498571776
Data rules. Opinions without data can be skewed
https://twitter.com/adamscrabble/status/1245378516721549322?s=20
This stuff is a wounder that takes 10 sure years off one’s life. Somebody doesn’t have 10 sure years, they’re not walking away. That 102-year-old guy is a miracle.
I smoked for 17 years 32 years ago. That was enough to almost kill me. My wife smoked a fraction of what I did, and came through it much better, despite being older.
I hope you can live a normal life as much as possible. I am sorry you had to go through that.
Thanks, Ed. I wish I knew how this was going to end up. I wish most of all that I knew I was virus-free.
Maybe it’s time to go looking for testing, even though I’m probably negative to the current virus test. I can try to cough up a deep lung sample for them first, maybe. 😉
Wolfie, can you try to schedule an appointment with a pulmonologist – even if they are currently swamped, they are most likely scheduling for a month or two from now. If nothing else, it gives you a date to feel like sOMETHING on your horizon is hopeful. Tell them you cannot breathe – because you can’t !!!!
What’s your take on Chris Cuomo? I saw a video of him that Citizen Free Press linked. He did not look sick at all. Is it possible for him to have the symptoms he said he had and still look that good?
There are 4 coronaviruses that are common around the world that may result in no symptoms or mild to moderate symptoms. The coronavirus test, if what I read is correct, is non-specific and general with respect to the detection of coronaviruses. He may have had one of those 4.
Thanks Carl. The reason I asked is Cuomo said he had some very vicious symptoms the night before yet he appeared relatively normal on his show.
Better picture of that chart for people who are 1/2 blind like me.
I just remembered that Central Park has a massive tunnel system. What are the odds that the “temporary hospital” is located on or near the entrance to this?
https://gizmodo.com/an-artificial-cave-200-beneath-central-park-with-micha-1446538828
That’s a sucker bet.
This is one of the creepiest things I have ever seen. God help us.
Strange.
And there was a series a couple of years ago, about underground tunnels, etc., in various cities. Portland Oregon has a huge network.
Hmmmm, and remember the article from yesterday (?) announcing the military was spending 500 million to train soldiers in underground warfare???
Hmmmmm…….
Seattle does, too.
But the article itself was dated 2018 and I remember reading it back then.
I’m honestly seeking answers.
Can someone explain why these underground sites are suddenly being promoted as an ‘aha the storm is here’ indication, and why I’m suddenly hearing that millions of children are going to be rescued? Are children being stored somewhere? For what purpose?
Everything I’ve understood about human trafficking is that it is MOVEMENT, not storage. They are moved in or out of countries, states, cities and into slavery (workplaces) or sex trade (working the streets or joints). Why would they be stored as inventory or for some other reason??
The present, growing implication is millions will be saved who are starved or so close to death they need these huge temporary hospitals. Why are millions being held in such near death condition? Who benefits from that? I thought the adrenochrome came from aborted fetuses so that’s not the reason. If it’s for organ transplants, wouldn’t the ‘inventory’ be shipped to China, or are millions of illicit transplants occurring here? If held fir transplant organs, wouldn’t they be held in tiptop shape instead of starving?
I cannot listen to the numerous videos that are posted (the music and shouting and time it takes to get to the meat of videos is a real time suck) – I would really like to READ some credible source that explains why I should believe any of this.
I am aware that MANY pedos and porn traffickers have been arrested lately. But the millions of kids in underground caves about to be rescued???
Alison, great efforts are being made to get a suffciently large number of people to forget how or why to ask the questions you just asked.
This entire adrenochrome theory is intended to distract and entrance – a shiny object. IMO of course. But there is literally zero empirical evidence to support it yet it keeps getting repeated as if it is a “settled” truth. Another “settled” issue is human-caused global climate change.
Keep asking impudent questions – at least you’ll annoy the enemy.
entrance s/b enchant
I do not have answers. I have not gotten the impression that people thought children/people were being held en masse in bunkers. I agree with you that the idea of trafficking is to move them from place to place, not to house them for a time. My guess is that if they use places like underground bunkers, it would be as a temporary waystation on the journey to somewhere else or even as a place to separate people out and decide where they should be sent. But I have nothing to back up these assumptions.
Glad somebody is calling out the PARALLEL DISTRACTO used to DISCREDIT.
Yes, there is a pedo underground. It’s not always a LITERAL underground, although many times it is (read the actual crime details – basements, cellars, etc. – very common). Tales of kids and women trapped in basements are real. So what is the cabal going to push? WRONG UNDERGROUND TO DISCREDIT.
This is exactly how these caballies cover up the crimes. Create parallel straw men and burn them, along with anybody who gloms onto them.
I watched how the Clinton / Brock operatives did this when the Hillary laptop surfaced in the middle of the Podesta emails. The child-sex Dems were DEATHLY AFRAID of what might be on there. I watched the researchers being LED, PUSHED, and SUCKERED into incredulity by political operatives. Tales of massive blood orgies, suspicion on every person who ever ate a pizza of any kind, disinformation of all kinds, and other things were used to distract away from simple truths like cabal symbols that truly give away these people to each other (and to us, if we pay attention).
What this does is leave people RIGHT IN PRINCIPLE (very frustrating) but WRONG IN SPECIFICS.
Find the REAL KIDS. Find the REAL PEDOS. Find the REAL EVIDENCE. Make it STICK.
It’s like the Chi-Com and CIA fake conservatives appearing as “bat soup” pushers now, only they are trying to deflect to cultural stereotypes – one of the ChiComs’ FAVORITE tricks.
FUCK THE CHICOMS. LOVE THE CHINESE PEOPLE. HATE THE CHICOMS.
Same principle here of STAYING ON THE HUNT while IGNORING THE MISLEADS. PURSUE THE REAL PEDOS AND CABAL HARD. IGNORE THEIR ATTEMPTS TO THROW US OFF.
One of the main reasons they are doing this now is to PROTECT THE CCP. Think about it. The CCP goes down, the TRAITORS go with them.
Thank you all who responded!! So I will continue to rejoice when DOJ or locals announce arrests and indictments but stop fretting about why I don’t understand what a number or symbol means and why the pending “It’s HERE!!!” never … quite… has… the promised crescendo.
I’ve never felt like “nothing’s happening” because a lot of enormous positive changes have occurred under President Trump. I’ve just reached the point – these underground caves and millions will be rescued exhortations – where I am not buying the hidden messages. I think the temporary hospitals etc. are to prepare for a surge in the virus infecteds. If they turn out to be for millions of saved children, I will celebrate; but I’m not spending my energy following that rabbit hole.
Just to clarify something for everyone, I was literally at my bathroom sink brushing my teeth when I suddenly remembered the Central Park tunnel and decided to post it here and at /qresearch/. I thought it was odd that in the past 24 hours, we had news of a temporary hospital in Central Park, then a picture of a “patient” in the same hospital wearing a red cabal ring, and then I remembered a story from years ago about the Central Park tunnels. That’s all. People are acting like it’s some disinformation campaign when, at least in my case, it was only a Shower Thought. I don’t know if there are children being rescued, if elites are hiding out trying to evade arrest, if it’s a staging ground for a military operation, or if it’s all merely a coincidence, but I thought it was worth mentioning.
But as for why they might keep children alive and in poor health? Traumatizing children is part of Satanic Ritual Abuse. Here’s a government document (.pdf) about it if you care to read the horrifying details:
https://www.ncjrs.gov/pdffiles1/Photocopy/140554NCJRS.pdf
I’m not sure why this automatically embedded, but here’s the link I tried to post above (I added two spaces before “gov” to intentionally break the link so that it wouldn’t embed).
https://www.ncjrs. gov/pdffiles1/Photocopy/140554NCJRS.pdf
Here’s the publication details:
https://www.ncjrs.gov/App/Publications/abstract.aspx?ID=140554
From abstract click PDF in mid of document to open in a separate window and or save
People are suffering and dying because of Democrat leadership and PC.
https://twitter.com/AlexMarlow/status/1245482659721228288
https://twitter.com/byzkanonist/status/1245316401675612163
Part 2 : the rioting
All I can say is that in my area, “that’s not who we are”. And we will not appreciate such behavior in our midst. I’m volunteering for Korean grocery store roof duty right now! 😎
Jazz great Ellis Marsalis succumbs to Coronavirus complications:
In the right age group. Sad. Very sad.
Horrible.
The song track my youth.
Saw him many times.
Great family.
R.I.P.
one of the greats.
jazz fans…released 1996…
NEEDLESS, If he had gotten treatment early.
You can lay his death at the feet of people like Nasty Nancy Messonnier and Tony Fauci.
For some reason this comment wouldn’t post at yesterday’s CV thread, so will try here… conversation found here if anyone wants more details…Perhaps there are too many links within so it will need to get out of jail free!


https://wqth.wordpress.com/2020/04/01/20200401-coronacrisis-china-virus-daily-thread/comment-page-2/#comment-449133
I found it!!! 2008-2009 Flu Season data hidden…
“2007-2008 & 2008-2009 seasons on display could also be instructive too to see if similar patterns were presenting in the lead up to BHO’s usurpation, especially because Hillary was an electoral factor up until Barry was “anointed” to be the dem’s candidate…” from my prior comment
I had to get into the Internet Archive to find data on 2008-2009 at this site:
https://web.archive.org/web/20111015082635/http://www.cdc.gov/mmwr/preview/mmwrhtml/mm5814a4.htm
Here this page is in its entirety, in case there is something important there:
Update: Influenza Activity — United States, September 28, 2008–April 4, 2009, and Composition of the 2009–10 Influenza Vaccine
This report summarizes U.S. influenza activity* from September 28, 2008, the start of the 2008–09 influenza season, through April 4, 2009, and reports on the 2009–10 influenza vaccine strain selection. Low levels of influenza activity were reported from October through early January. Activity increased from mid-January and peaked in mid-February. Influenza A (H1N1) viruses have predominated overall this season, but influenza B viruses have been isolated more frequently than influenza A viruses since mid-March. Widespread oseltamivir resistance was detected among circulating influenza A (H1N1) viruses and a high level of adamantane resistance was identified among influenza A (H3N2) viruses.
Viral Surveillance
From September 28, 2008, to April 4, 2009, World Health Organization (WHO) and National Respiratory and Enteric Virus Surveillance System (NREVSS) collaborating laboratories in the United States tested 173,397 respiratory specimens for influenza viruses, 24,793 (14.3%) of which were positive (Figure 1). Of these, 16,686 (67.3%) were positive for influenza A viruses, and 8,107 (32.7%) were positive for influenza B viruses. Of the 16,686 specimens positive for influenza A viruses, 6,735 (40.4%) were subtyped by real-time reverse transcription-polymerase chain reaction or by virus culture; 6,049 (89.8%) of these were influenza A (H1N1) viruses, and 686 (10.2%) were influenza A (H3N2) viruses. The percentage of specimens testing positive for influenza first exceeded the seasonal threshold of 10% during the week ending January 17, 2009, and peaked at 25.0% during the week ending February 14, 2009. For the week ending April 4, 2009, 12.3% of specimens tested for influenza were positive. The relative proportion of influenza B viruses increased during February and March, and since the week ending March 14, 2009, >50% of the positive influenza specimens have been influenza B.
Antigenic Characterization
WHO collaborating laboratories in the United States are requested to submit a subset of their influenza virus isolates to CDC for further antigenic characterization. CDC has antigenically characterized 945 influenza viruses collected by U.S. laboratories during the 2008–09 season, including 594 influenza A (H1N1), 88 influenza A (H3N2), and 263 influenza B viruses. All 594 influenza A (H1N1) viruses are related to the influenza A (H1N1) component of the 2008–09 influenza vaccine (A/Brisbane/59/2007). All 88 influenza A (H3N2) viruses are related to the influenza A (H3N2) vaccine component (A/Brisbane/10/2007). Influenza B viruses currently circulating can be divided into two distinct lineages represented by the B/Yamagata/16/88 and B/Victoria/02/87 viruses. Among the 263 influenza B viruses tested, 50 (19.0%) belong to the B/Yamagata lineage and are related to the vaccine strain (B/Florida/04/2006); the remaining 213 (81.0%) belong to the B/Victoria lineage and are not related to the vaccine strain.
Composition of the 2009–10 Influenza Vaccine
WHO recommended that the 2009–10 Northern Hemisphere trivalent influenza vaccine contain A/Brisbane/59/2007-like (H1N1), A/Brisbane/10/2007-like (H3N2), and B/Brisbane/60/2008-like (B/Victoria lineage) viruses. The Food and Drug Administration’s Vaccines and Related Biological Products Advisory Committee recommended these same vaccine strains be included in the 2009–10 influenza vaccine for the United States (1). Only the influenza B component represents a change from the 2008–09 vaccine formulation. These recommendations were based on antigenic and genetic analyses of recently isolated influenza viruses, epidemiologic data, post-vaccination serologic studies in humans, and the availability of candidate vaccine strains and reagents.
Antiviral Resistance of Influenza Virus Isolates
CDC conducts surveillance for resistance of circulating influenza viruses to licensed influenza antiviral medications: adamantanes (amantadine and rimantadine) and neuraminidase inhibitors (zanamivir and oseltamivir). Since October 1, 2008, of the 699 influenza A (H1N1) viruses from 44 states tested for neuraminidase inhibitor resistance, 694 (99.3%) were resistant to oseltamivir; all were sensitive to zanamivir (Table). All 103 influenza A (H3N2) and all 274 influenza B viruses tested were sensitive to oseltamivir and zanamivir. Three influenza A (H1N1) viruses (0.4%) and all 100 (100%) influenza A (H3N2) viruses tested were resistant to adamantanes (amantadine and rimantadine). The adamantanes are not effective against influenza B viruses. None of the influenza A (H1N1) viruses tested were resistant to both oseltamivir and adamantanes.
Novel Influenza A Viruses
A case of human infection with a novel influenza A virus was reported by the Iowa Department of Public Health during the week ending February 28, 2009. A male aged 3 years was infected with a swine influenza A (H1N1) virus. An investigation revealed that the child had close contact with ill pigs. The child has fully recovered from the illness, and no additional cases were identified among the child’s contacts or other persons exposed to the ill pigs. This is the third human infection with swine influenza virus identified in the United States this influenza season. None of the cases were related to occupation. The other two human infections with swine influenza identified during the 2008–09 influenza season occurred in a person aged 14 years from Texas and a person aged 19 years from South Dakota (2,3).
State-Specific Activity Levels
During the week ending April 4, 2009, widespread influenza activity† was reported by four states (Alabama, New York, Virginia, and Washington). Regional influenza activity was reported by 18 states (Alaska, Arizona, California, Colorado, Connecticut, Hawaii, Idaho, Kentucky, Montana, Nevada, New Hampshire, New Jersey, North Carolina, North Dakota, Oregon, Pennsylvania, Rhode Island, and Tennessee). Local influenza activity was reported by 20 states, sporadic activity was reported by the District of Columbia and seven states, and one state did not report Regional influenza activity was reported for the first time this season during the week ending December 20, 2008 (by Massachusetts and New Jersey), and widespread activity was reported for the first time during the week ending January 10, 2009 (by Virginia). To date this season, regional or widespread influenza activity has been reported during at least 1 week by 49 states.
Outpatient Illness Surveillance
Since September 28, 2008, the weekly percentage of outpatient visits for influenza-like illness (ILI)§ reported by approximately 1,500 U.S. health-care providers in 50 states, New York City, Chicago, the District of Columbia, and the U.S. Virgin Islands that comprise the U.S. Outpatient ILI Surveillance Network (ILINet), has ranged from 0.9% during the week ending October 4, 2008, to 3.7% for the week ending February 14, 2009. For the week ending April 4, 2009, the weekly percentage of outpatient visits for ILI was 1.6% (Figure 2). This is below the national baseline of 2.4%.¶ One of the nine surveillance regions (Mountain) reported an ILI percentage above its region-specific baseline.
Pneumonia- and Influenza-Related Mortality
For the week ending April 4, 2009, pneumonia and influenza was reported as an underlying or contributing cause of death for 7.4% of all deaths reported through the 122 Cities Mortality Reporting System. This is below the epidemic threshold of 7.8% for that week. Since September 28, 2008, the weekly percentage of deaths attributed to pneumonia and influenza ranged from 6.1% to 7.6%, and remained below the epidemic threshold.**
Influenza-Associated Hospitalizations
Hospitalizations associated with laboratory-confirmed influenza infections are monitored by two population-based surveillance networks, the New Vaccine Surveillance Network (NVSN) and the Emerging Infections Program (EIP).†† From October 12, 2008, to March 21, 2009, the preliminary laboratory-confirmed influenza-associated hospitalization rate for children aged 0–4 years in the NVSN was 1.46 per 10,000.
From October 1, 2008, to March 28, 2009, preliminary rates of laboratory-confirmed influenza-associated hospitalization reported by the EIP for children aged 0–4 years and 5–17 years were 2.8 and 0.5 per 10,000, respectively (Figure 3). For adults aged 18–49 years, 50–64 years, and ≥65 years, the rates were 0.3, 0.4, and 1.0 per 10,000, respectively. Differences in the rate estimates between the NVSN and the EIP systems likely result from the different case-finding methods and the different populations monitored.
Influenza-Associated Pediatric Mortality
Since September 28, 2008, CDC has received 45 reports of influenza-associated pediatric deaths that occurred during the current season. Of the 27 decedents who had specimens collected for bacterial culture from normally sterile sites, 12 (44.4%) were positive; Staphylococcus aureus was identified in eight of the 12 children. Three of the S. aureus isolates were sensitive to methicillin, and five were methicillin resistant. Among the 12 children with bacterial coinfections, all were aged ≥5 years, and 10 (83.3%) were aged ≥12 years. An increase in the number of influenza-associated pediatric deaths with S. aureus coinfections was first recognized during the 2006–07 influenza season (4).
Of the 36 decedents aged >6 months for whom patient vaccination status was known, five (13.9%) had been vaccinated against influenza according to 2008 Advisory Committee on Immunization Practices recommendations (5). These data are provisional and subject to change as more information becomes available.
Reported by: WHO Collaborating Center for Surveillance, Epidemiology, and Control of Influenza. P Peebles, L Brammer, MPH, S Epperson, MPH, L Blanton, MPH, R Dhara, MPH, T Wallis, MS, L Finelli, DrPH, L Gubareva, PhD, J Bresee, MD, A Klimov, PhD, N Cox, PhD, Influenza Div, National Center for Immunization and Respiratory Diseases, CDC.
Editorial Note:
From September 28, 2008, through early January 2009, the United States experienced low levels of influenza activity. Activity increased in mid-January, peaked in mid-February, and remained high until mid-March. Since mid-March, influenza levels have been decreasing nationally.
Preliminary data from the U.S. virologic surveillance networks (WHO and NREVSS collaborating laboratories), the percentage of deaths attributable to pneumonia and influenza, and the percentage of outpatient visits for ILI suggest that this season has been less severe than the 2007–08 season and is more similar to the 2005–06 and 2006–07 seasons. The percentage of specimens tested for influenza that were positive peaked at 25.0% during the week ending February 14, 2009, compared with 31.6% in 2007–08, 27.7% in 2006–07, and 22.6% in 2005–06. To date during this season, the percentage of deaths attributable to pneumonia and influenza peaked at 7.6% and has not exceeded the epidemic threshold. By comparison, pneumonia and influenza mortality peaked at 9.1%, 7.9%, and 7.8% during the 2007–08, 2006–07, and 2005–06 seasons, respectively. The epidemic threshold for pneumonia and influenza deaths was exceeded for 9 consecutive weeks during the 2007–08 season and for only 1 week during both the 2005–06 and 2006–07 seasons. The percentage of outpatient visits for ILI peaked at 3.7% this season, compared with 6.0% in 2007–08, 3.6% in 2006–07, and 3.1% in 2005–06.
During this influenza season, a high level of resistance to the antiviral drug oseltamivir was detected among circulating influenza A (H1N1) viruses. Since October 1, 2008, 99.3% of influenza A (H1N1) viruses tested were resistant to oseltamivir. To date, influenza A has accounted for 67.3% of all influenza viruses identified, and influenza A (H1N1) has accounted for 89.8% of the influenza A viruses that were subtyped. No oseltamivir resistance has been detected among influenza A (H3N2) or B viruses currently circulating in the United States; however, all the influenza A (H3N2) viruses tested were resistant to adamantanes. The adamantanes are not effective against influenza B viruses. None of the influenza A (H1N1) viruses tested were resistant to both oseltamivir and the adamantanes, and all influenza viruses tested this season have been susceptible to zanamivir. CDC issued interim guidelines for the use of influenza antiviral medications on December 19, 2008. Health-care providers should review their local surveillance data if available to determine which types (A or B) and subtypes of influenza A (H1N1 or H3N2) are most prominent in their community and consider using diagnostic tests to distinguish influenza A from influenza B. When an influenza A (H1N1) virus infection or exposure is suspected, zanamivir is the preferred medication; combination therapy of oseltamivir and rimantidine is an acceptable alternative (6).
Since early February, the relative proportion of influenza B viruses has been increasing each week, and more than half of influenza viruses identified since the week ending March 14, 2009, were influenza B. Approximately 80% of influenza B viruses tested have not been related to the influenza B vaccine strain. However, all influenza B viruses this season have been susceptible to oseltamivir and zanamivir. Health-care providers should be aware of these recent increases in influenza B viruses and of the differences in antiviral resistance patterns compared with influenza A (H1N1) viruses. When an influenza B infection or exposure is detected, treatment with oseltamivir or zanamivir is recommended. However, when the type or subtype is unknown, zanamivir is the preferred medication; combination therapy of oseltamivir and rimantidine also is acceptable (6).
To date this season, the cumulative laboratory-confirmed, influenza-associated hospitalization rate reported by EIP among persons aged ≥50 years has been lower than rates reported for the previous three seasons, but most similar to the 2006–07 season. Historically, excess mortality has been lower in seasons during which influenza A (H1N1) or influenza B predominated than during seasons in which influenza A (H3N2) has predominated (7). During the current and 2006–07 seasons, influenza A (H1N1) has been the prominent virus subtype circulating, which could partly explain the lower influenza-associated hospitalization rates among persons aged ≥50 years observed during these two seasons.
Vaccination remains the best method for preventing influenza virus infection and its complications. Influenza vaccination can prevent influenza infections from strains that are sensitive or resistant to antiviral medications. Thus far this season, all the influenza A viruses that have been characterized, including oseltamivir-resistant (H1N1) viruses, are antigenically related to the components in the vaccine. However, approximately 80% of influenza B viruses tested are from a distinct lineage that is not related to the vaccine strain. Limited or no protection is expected when the vaccine and circulating virus strains are from different lineages (8,9). The composition of the 2009–10 influenza vaccine includes the same influenza A (H1N1 and H3N2) components, and a change in the influenza B component from the Yamagata to the Victoria lineage.
Influenza surveillance reports for the United States are posted weekly online at http://www.cdc.gov/flu/weekly/flu
activity.htm during the influenza season from October to mid-May. Additional information regarding influenza viruses, influenza surveillance, the influenza vaccine, and avian influenza is available at http://www.cdc.gov/flu.
Acknowledgments
This report is based, in part, on data contributed by participating state and territorial health departments and state public health laboratories, World Health Organization collaborating laboratories, National Respiratory and Enteric Virus Surveillance System collaborating laboratories, the U.S. Outpatient ILI Surveillance Network, the Emerging Infections Program, the New Vaccine Surveillance Network, the Influenza Associated Pediatric Mortality Surveillance System, and the 122 Cities Mortality Reporting System.
References
Food and Drug Administration. Influenza virus vaccine 2009–2010 season. Available at http://www.fda.gov/cber/flu/flu2009.htm.
CDC. Influenza activity—United States and worldwide, September 28–November 29, 2008. MMWR 2008;57:1329–32.
CDC. Influenza activity—United States, September 28, 2008–January 31, 2009. MMWR 2009;58:115–9.
Finelli L, Fiore A, Dhara R, et al. Influenza-associated pediatric mortality in the United States: increase of Staphylococcus aureus coinfection. Pediatrics 2008;122:805–11.
CDC. Recommendations of the Advisory Committee on Immunization Practices (ACIP), 2008. MMWR 2008;57(No. RR-7).
CDC. CDC issues interim recommendations for the use of influenza antiviral medications in the setting of oseltamivir resistance among circulating influenza A (H1N1) viruses, 2008–09 influenza season. Atlanta, GA: US Department of Health and human services, CDC; 2008. Available at http://www2a.cdc.gov/han/archivesys/viewmsgv.asp?alertnum=00279.
Thompson WW, Shay DK, Weintraub E, et al. Mortality associated with influenza and respiratory syncytial virus in the United States. JAMA 2003;289:179–86.
Belongia E, Kieke B, Donahue J, et al. Effectiveness of inactivated influenza vaccines varied substantially with antigenic match from the 2004–2005 season to the 2006–2007 season. J Infect Dis 2009;199:159–67.
Skowronski D, De Serres G, Dickinson J, et al. Component-specific effectiveness of trivalent influenza vaccine as monitored through a sentinel surveillance network in Canada, 2006–2007. J Infect Dis 2009;199:168–79.
* The CDC influenza surveillance system collects five categories of information from nine data sources: 1) viral surveillance (World Health Organization collaborating U.S. laboratories, the National Respiratory and Enteric Virus Surveillance System, and novel influenza A virus case reporting), 2) outpatient illness surveillance (U.S. Outpatient ILI Surveillance Network), 3) mortality (122 Cities Mortality Reporting System and influenza-associated pediatric mortality reports), 4) hospitalizations (Emerging Infections Program and New Vaccine Surveillance Network), and 5) summary of geographic spread of influenza (state and territorial epidemiologist reports).
† Levels of activity are 1) no activity; 2) sporadic: isolated laboratory-confirmed influenza cases or a laboratory-confirmed outbreak in one institution, with no increase in influenza-like illness (ILI) activity; 3) local: increased ILI, or at least two institutional outbreaks (ILI or laboratory-confirmed influenza) in one region with recent laboratory evidence of influenza in that region; virus activity no greater than sporadic in other regions; 4) regional: increased ILI activity or institutional outbreaks (ILI or laboratory-confirmed influenza) in at least two but less than half of the regions in the state with recent laboratory evidence of influenza in those regions; and 5) widespread: increased ILI activity or institutional outbreaks (ILI or laboratory-confirmed influenza) in at least half the regions in the state with recent laboratory evidence of influenza in the state.
§ Defined as a temperature of ≥100.0°F (≥37.8°C), oral or equivalent, and cough and/or sore throat, in the absence of a known cause other than influenza.
¶ The national and regional baselines are the mean percentage of visits for ILI during noninfluenza weeks for the previous three seasons plus two standard deviations. A noninfluenza week is a week during which <10% of specimens tested positive for influenza. National and regional percentages of patient visits for ILI are weighted on the basis of state population. Use of the national baseline for regional data is not appropriate.
** The seasonal baseline proportion of pneumonia and influenza deaths is projected using a robust regression procedure in which a periodic regression model is applied to the observed percentage of deaths from pneumonia and influenza that were reported by the 122 Cities Mortality Reporting System during the preceding 5 years. The epidemic threshold is 1.645 standard deviations above the seasonal baseline.
†† NVSN conducts surveillance in Monroe County, New York; Hamilton County, Ohio; and Davidson County, Tennessee. NVSN provides population-based estimates of laboratory-confirmed influenza hospitalization rates in children aged <5 years admitted to NVSN hospitals with fever or respiratory symptoms. Children are prospectively enrolled, and respiratory samples are collected and tested by viral culture and reverse transcription-polymerase chain reaction (RT-PCR). EIP currently conducts surveillance for laboratory-confirmed, influenza-related hospitalizations in 61 counties and Baltimore, Maryland. The EIP catchment area includes 13 metropolitan areas: San Francisco, California; Denver, Colorado; New Haven, Connecticut; Atlanta, Georgia; Baltimore, Maryland; Minneapolis/St. Paul, Minnesota; Albuquerque, New Mexico; Las Cruces, New Mexico; Santa Fe, New Mexico; Albany, New York; Rochester, New York; Portland, Oregon; and Nashville, Tennessee. Hospital laboratory, admission, and discharge databases, and infection-control logs are reviewed to identify persons with a positive influenza test (i.e., viral culture, direct fluorescent antibody assays, RT-PCR, serology, or a commercial rapid antigen test) from testing conducted as part of their routine care.
FIGURE 1. Number (N = 24,793) and percentage of respiratory specimens testing positive for influenza reported by World Health Organization and National Respiratory and Enteric Virus Surveillance System collaborating laboratories, by type, and surveillance week – United States, September 28, 2008-April 4, 2009
Number (N = 24,793) and percentage of respiratory specimens testing positive for influenza reported by World Health Organization and National Respiratory and Enteric Virus Surveillance System collaborating laboratories, by type, and surveillance week – United States, September 28, 2008-April 4, 2009
Return to top.
TABLE. Number and percentage of influenza viruses tested for resistance to influenza antiviral medications, by virus type — United States, October 1, 2008–April 4, 2009
Virus
No. of isolates tested
Resistant to oseltamivir*
No. of isolates tested
Resistant to adamantanes
No.
(%)
No.
(%)
Influenza A (H1N1)
699
694
(99.3)
683
3
(0.4)
Influenza A (H3N2)
103
(0)
100
100
(100)
Influenza B
274
(0)
-†
–
–
* None of the tested isolates were resistant to zanamivir.
† The adamantanes (amantadine and rimantadine) are not effective against influenza B viruses.
Return to top.
FIGURE 2. Percentage of visits for influenza-like illness (ILI) reported by U.S. Outpatient Influenza-like Illness Surveillance Network (ILINet), by surveillance week – United States, September 28, 2008-April 4, 2009 and 2006-07 and 2007-08 influenza seasons
Percentage of visits for influenza-like illness (ILI) reported by U.S. Outpatient Influenza-like Illness Surveillance Network (ILINet), by surveillance week – United States, September 28, 2008-April 4, 2009 and 2006-07 and 2007-08 influenza seasons
* The 2006-07 and 2007-08 seasons did not have a week 53; therefore the week 53 data point for those seasons is an average of weeks 52 and 1.
† The national and regional baselines are the mean percentage of visits for ILI during noninfluenza weeks for the previous three seasons plus two standard deviations. A noninfluenza week is a week during which <10% of specimens tested positive for influenza. National and regional percentages of patient visits for ILI are weighted on the basis of state population. Use of the national baseline for regional data is not appropriate.
Return to top.
FIGURE 3. Cumulative laboratory-confirmed influenza hospitalization rates,* by age group† and surveillance week – Emerging Infections Program, United States, October 1, 2008-March 28, 2009, and preceding three influenza seasons
Cumulative laboratory-confirmed influenza hospitalization rates,* by age group† and surveillance week – Emerging Infections Program, United States, October 1, 2008-March 28, 2009, and preceding three influenza seasons
* Per 10,000 population.
† Scales differ among age groups.
Return to top.
Use of trade names and commercial sources is for identification only and does not imply endorsement by the U.S. Department of Health and Human Services.
References to non-CDC sites on the Internet are provided as a service to MMWR readers and do not constitute or imply endorsement of these organizations or their programs by CDC or the U.S. Department of Health and Human Services. CDC is not responsible for the content of pages found at these sites. URL addresses listed in MMWR were current as of the date of publication.
All MMWR HTML versions of articles are electronic conversions from typeset documents. This conversion might result in character translation or format errors in the HTML version. Users are referred to the electronic PDF version (http://www.cdc.gov/mmwr) and/or the original MMWR paper copy for printable versions of official text, figures, and tables. An original paper copy of this issue can be obtained from the Superintendent of Documents, U.S. Government Printing Office (GPO), Washington, DC 20402-9371; telephone: (202) 512-1800. Contact GPO for current prices.
**Questions or messages regarding errors in formatting should be addressed to mmwrq@cdc.gov.
Date last reviewed: 4/15/2009
I wonder if part of why this particular season was hidden was because of the final chart showing multiple seasons in comparison…
The 2008-2009 flu season data was still available here, but there were no Q & As, unlike every other year accessible from this page:
https://web.archive.org/web/20160414192006/http://www.cdc.gov:80/flu/pastseasons/
This link discusses 2009-2010 flu season & refers to the previous season
https://web.archive.org/web/20150207121642/http://www.cdc.gov/flu/pastseasons/0910season.htm
This one has data about the 2009 H1N1 PANDEMIC…
https://web.archive.org/web/20150206004704/http://www.cdc.gov/h1n1flu/
This represents the last capture of that page before its 8-1810 update:
https://web.archive.org/web/20100715010537/http://www.cdc.gov/h1n1flu/
Here are images of the H1N1 virus that bears remarkable similarity, in certain respects to the coronavirus
https://web.archive.org/web/20100715140242/http://www.cdc.gov/h1n1flu/images.htm
Numerous reports here:
https://web.archive.org/web/20100803093548/http://www.cdc.gov/h1n1flu/pubs/
lots of pandemic info for H1N1 here
https://web.archive.org/web/20100803093701/http://www.cdc.gov/h1n1flu/related_links.htm
The 2009 H1N1 Pandemic: Summary Highlights, April 2009-April 2010
https://web.archive.org/web/20100715132743/http://www.cdc.gov/h1n1flu/cdcresponse.htm
well, I'm running out of gas so will let this stand "as is" forgive my feet of clay please…Blessings!
Part 1 of something the CDC seems to want hidden…
For some reason this comment wouldn’t post at yesterday’s CV thread, so will try here… conversation found here if anyone wants more details…Perhaps there are too many links within so it will need to get out of jail free!
https://wqth.wordpress.com/2020/04/01/20200401-coronacrisis-china-virus-daily-thread/comment-page-2/#comment-449133
I found it!!! 2008-2009 Flu Season data hidden…
“2007-2008 & 2008-2009 seasons on display could also be instructive too to see if similar patterns were presenting in the lead up to BHO’s usurpation, especially because Hillary was an electoral factor up until Barry was “anointed” to be the dem’s candidate…” from my prior comment
I had to get into the Internet Archive to find data on 2008-2009 at this site:
https://web.archive.org/web/20111015082635/http://www.cdc.gov/mmwr/preview/mmwrhtml/mm5814a4.htm
Here this page is in its entirety, in case there is something important there:
Update: Influenza Activity — United States, September 28, 2008–April 4, 2009, and Composition of the 2009–10 Influenza Vaccine
This report summarizes U.S. influenza activity* from September 28, 2008, the start of the 2008–09 influenza season, through April 4, 2009, and reports on the 2009–10 influenza vaccine strain selection. Low levels of influenza activity were reported from October through early January. Activity increased from mid-January and peaked in mid-February. Influenza A (H1N1) viruses have predominated overall this season, but influenza B viruses have been isolated more frequently than influenza A viruses since mid-March. Widespread oseltamivir resistance was detected among circulating influenza A (H1N1) viruses and a high level of adamantane resistance was identified among influenza A (H3N2) viruses.
Viral Surveillance
From September 28, 2008, to April 4, 2009, World Health Organization (WHO) and National Respiratory and Enteric Virus Surveillance System (NREVSS) collaborating laboratories in the United States tested 173,397 respiratory specimens for influenza viruses, 24,793 (14.3%) of which were positive (Figure 1). Of these, 16,686 (67.3%) were positive for influenza A viruses, and 8,107 (32.7%) were positive for influenza B viruses. Of the 16,686 specimens positive for influenza A viruses, 6,735 (40.4%) were subtyped by real-time reverse transcription-polymerase chain reaction or by virus culture; 6,049 (89.8%) of these were influenza A (H1N1) viruses, and 686 (10.2%) were influenza A (H3N2) viruses. The percentage of specimens testing positive for influenza first exceeded the seasonal threshold of 10% during the week ending January 17, 2009, and peaked at 25.0% during the week ending February 14, 2009. For the week ending April 4, 2009, 12.3% of specimens tested for influenza were positive. The relative proportion of influenza B viruses increased during February and March, and since the week ending March 14, 2009, >50% of the positive influenza specimens have been influenza B.
Antigenic Characterization
WHO collaborating laboratories in the United States are requested to submit a subset of their influenza virus isolates to CDC for further antigenic characterization. CDC has antigenically characterized 945 influenza viruses collected by U.S. laboratories during the 2008–09 season, including 594 influenza A (H1N1), 88 influenza A (H3N2), and 263 influenza B viruses. All 594 influenza A (H1N1) viruses are related to the influenza A (H1N1) component of the 2008–09 influenza vaccine (A/Brisbane/59/2007). All 88 influenza A (H3N2) viruses are related to the influenza A (H3N2) vaccine component (A/Brisbane/10/2007). Influenza B viruses currently circulating can be divided into two distinct lineages represented by the B/Yamagata/16/88 and B/Victoria/02/87 viruses. Among the 263 influenza B viruses tested, 50 (19.0%) belong to the B/Yamagata lineage and are related to the vaccine strain (B/Florida/04/2006); the remaining 213 (81.0%) belong to the B/Victoria lineage and are not related to the vaccine strain.
Composition of the 2009–10 Influenza Vaccine
WHO recommended that the 2009–10 Northern Hemisphere trivalent influenza vaccine contain A/Brisbane/59/2007-like (H1N1), A/Brisbane/10/2007-like (H3N2), and B/Brisbane/60/2008-like (B/Victoria lineage) viruses. The Food and Drug Administration’s Vaccines and Related Biological Products Advisory Committee recommended these same vaccine strains be included in the 2009–10 influenza vaccine for the United States (1). Only the influenza B component represents a change from the 2008–09 vaccine formulation. These recommendations were based on antigenic and genetic analyses of recently isolated influenza viruses, epidemiologic data, post-vaccination serologic studies in humans, and the availability of candidate vaccine strains and reagents.
Antiviral Resistance of Influenza Virus Isolates
CDC conducts surveillance for resistance of circulating influenza viruses to licensed influenza antiviral medications: adamantanes (amantadine and rimantadine) and neuraminidase inhibitors (zanamivir and oseltamivir). Since October 1, 2008, of the 699 influenza A (H1N1) viruses from 44 states tested for neuraminidase inhibitor resistance, 694 (99.3%) were resistant to oseltamivir; all were sensitive to zanamivir (Table). All 103 influenza A (H3N2) and all 274 influenza B viruses tested were sensitive to oseltamivir and zanamivir. Three influenza A (H1N1) viruses (0.4%) and all 100 (100%) influenza A (H3N2) viruses tested were resistant to adamantanes (amantadine and rimantadine). The adamantanes are not effective against influenza B viruses. None of the influenza A (H1N1) viruses tested were resistant to both oseltamivir and adamantanes.
Novel Influenza A Viruses
A case of human infection with a novel influenza A virus was reported by the Iowa Department of Public Health during the week ending February 28, 2009. A male aged 3 years was infected with a swine influenza A (H1N1) virus. An investigation revealed that the child had close contact with ill pigs. The child has fully recovered from the illness, and no additional cases were identified among the child’s contacts or other persons exposed to the ill pigs. This is the third human infection with swine influenza virus identified in the United States this influenza season. None of the cases were related to occupation. The other two human infections with swine influenza identified during the 2008–09 influenza season occurred in a person aged 14 years from Texas and a person aged 19 years from South Dakota (2,3).
State-Specific Activity Levels
During the week ending April 4, 2009, widespread influenza activity† was reported by four states (Alabama, New York, Virginia, and Washington). Regional influenza activity was reported by 18 states (Alaska, Arizona, California, Colorado, Connecticut, Hawaii, Idaho, Kentucky, Montana, Nevada, New Hampshire, New Jersey, North Carolina, North Dakota, Oregon, Pennsylvania, Rhode Island, and Tennessee). Local influenza activity was reported by 20 states, sporadic activity was reported by the District of Columbia and seven states, and one state did not report Regional influenza activity was reported for the first time this season during the week ending December 20, 2008 (by Massachusetts and New Jersey), and widespread activity was reported for the first time during the week ending January 10, 2009 (by Virginia). To date this season, regional or widespread influenza activity has been reported during at least 1 week by 49 states.
Outpatient Illness Surveillance
Since September 28, 2008, the weekly percentage of outpatient visits for influenza-like illness (ILI)§ reported by approximately 1,500 U.S. health-care providers in 50 states, New York City, Chicago, the District of Columbia, and the U.S. Virgin Islands that comprise the U.S. Outpatient ILI Surveillance Network (ILINet), has ranged from 0.9% during the week ending October 4, 2008, to 3.7% for the week ending February 14, 2009. For the week ending April 4, 2009, the weekly percentage of outpatient visits for ILI was 1.6% (Figure 2). This is below the national baseline of 2.4%.¶ One of the nine surveillance regions (Mountain) reported an ILI percentage above its region-specific baseline.
Pneumonia- and Influenza-Related Mortality
For the week ending April 4, 2009, pneumonia and influenza was reported as an underlying or contributing cause of death for 7.4% of all deaths reported through the 122 Cities Mortality Reporting System. This is below the epidemic threshold of 7.8% for that week. Since September 28, 2008, the weekly percentage of deaths attributed to pneumonia and influenza ranged from 6.1% to 7.6%, and remained below the epidemic threshold.**
Influenza-Associated Hospitalizations
Hospitalizations associated with laboratory-confirmed influenza infections are monitored by two population-based surveillance networks, the New Vaccine Surveillance Network (NVSN) and the Emerging Infections Program (EIP).†† From October 12, 2008, to March 21, 2009, the preliminary laboratory-confirmed influenza-associated hospitalization rate for children aged 0–4 years in the NVSN was 1.46 per 10,000.
From October 1, 2008, to March 28, 2009, preliminary rates of laboratory-confirmed influenza-associated hospitalization reported by the EIP for children aged 0–4 years and 5–17 years were 2.8 and 0.5 per 10,000, respectively (Figure 3). For adults aged 18–49 years, 50–64 years, and ≥65 years, the rates were 0.3, 0.4, and 1.0 per 10,000, respectively. Differences in the rate estimates between the NVSN and the EIP systems likely result from the different case-finding methods and the different populations monitored.
Influenza-Associated Pediatric Mortality
Since September 28, 2008, CDC has received 45 reports of influenza-associated pediatric deaths that occurred during the current season. Of the 27 decedents who had specimens collected for bacterial culture from normally sterile sites, 12 (44.4%) were positive; Staphylococcus aureus was identified in eight of the 12 children. Three of the S. aureus isolates were sensitive to methicillin, and five were methicillin resistant. Among the 12 children with bacterial coinfections, all were aged ≥5 years, and 10 (83.3%) were aged ≥12 years. An increase in the number of influenza-associated pediatric deaths with S. aureus coinfections was first recognized during the 2006–07 influenza season (4).
Of the 36 decedents aged >6 months for whom patient vaccination status was known, five (13.9%) had been vaccinated against influenza according to 2008 Advisory Committee on Immunization Practices recommendations (5). These data are provisional and subject to change as more information becomes available.
Reported by: WHO Collaborating Center for Surveillance, Epidemiology, and Control of Influenza. P Peebles, L Brammer, MPH, S Epperson, MPH, L Blanton, MPH, R Dhara, MPH, T Wallis, MS, L Finelli, DrPH, L Gubareva, PhD, J Bresee, MD, A Klimov, PhD, N Cox, PhD, Influenza Div, National Center for Immunization and Respiratory Diseases, CDC.
Editorial Note:
From September 28, 2008, through early January 2009, the United States experienced low levels of influenza activity. Activity increased in mid-January, peaked in mid-February, and remained high until mid-March. Since mid-March, influenza levels have been decreasing nationally.
Preliminary data from the U.S. virologic surveillance networks (WHO and NREVSS collaborating laboratories), the percentage of deaths attributable to pneumonia and influenza, and the percentage of outpatient visits for ILI suggest that this season has been less severe than the 2007–08 season and is more similar to the 2005–06 and 2006–07 seasons. The percentage of specimens tested for influenza that were positive peaked at 25.0% during the week ending February 14, 2009, compared with 31.6% in 2007–08, 27.7% in 2006–07, and 22.6% in 2005–06. To date during this season, the percentage of deaths attributable to pneumonia and influenza peaked at 7.6% and has not exceeded the epidemic threshold. By comparison, pneumonia and influenza mortality peaked at 9.1%, 7.9%, and 7.8% during the 2007–08, 2006–07, and 2005–06 seasons, respectively. The epidemic threshold for pneumonia and influenza deaths was exceeded for 9 consecutive weeks during the 2007–08 season and for only 1 week during both the 2005–06 and 2006–07 seasons. The percentage of outpatient visits for ILI peaked at 3.7% this season, compared with 6.0% in 2007–08, 3.6% in 2006–07, and 3.1% in 2005–06.
During this influenza season, a high level of resistance to the antiviral drug oseltamivir was detected among circulating influenza A (H1N1) viruses. Since October 1, 2008, 99.3% of influenza A (H1N1) viruses tested were resistant to oseltamivir. To date, influenza A has accounted for 67.3% of all influenza viruses identified, and influenza A (H1N1) has accounted for 89.8% of the influenza A viruses that were subtyped. No oseltamivir resistance has been detected among influenza A (H3N2) or B viruses currently circulating in the United States; however, all the influenza A (H3N2) viruses tested were resistant to adamantanes. The adamantanes are not effective against influenza B viruses. None of the influenza A (H1N1) viruses tested were resistant to both oseltamivir and the adamantanes, and all influenza viruses tested this season have been susceptible to zanamivir. CDC issued interim guidelines for the use of influenza antiviral medications on December 19, 2008. Health-care providers should review their local surveillance data if available to determine which types (A or B) and subtypes of influenza A (H1N1 or H3N2) are most prominent in their community and consider using diagnostic tests to distinguish influenza A from influenza B. When an influenza A (H1N1) virus infection or exposure is suspected, zanamivir is the preferred medication; combination therapy of oseltamivir and rimantidine is an acceptable alternative (6).
Since early February, the relative proportion of influenza B viruses has been increasing each week, and more than half of influenza viruses identified since the week ending March 14, 2009, were influenza B. Approximately 80% of influenza B viruses tested have not been related to the influenza B vaccine strain. However, all influenza B viruses this season have been susceptible to oseltamivir and zanamivir. Health-care providers should be aware of these recent increases in influenza B viruses and of the differences in antiviral resistance patterns compared with influenza A (H1N1) viruses. When an influenza B infection or exposure is detected, treatment with oseltamivir or zanamivir is recommended. However, when the type or subtype is unknown, zanamivir is the preferred medication; combination therapy of oseltamivir and rimantidine also is acceptable (6).
To date this season, the cumulative laboratory-confirmed, influenza-associated hospitalization rate reported by EIP among persons aged ≥50 years has been lower than rates reported for the previous three seasons, but most similar to the 2006–07 season. Historically, excess mortality has been lower in seasons during which influenza A (H1N1) or influenza B predominated than during seasons in which influenza A (H3N2) has predominated (7). During the current and 2006–07 seasons, influenza A (H1N1) has been the prominent virus subtype circulating, which could partly explain the lower influenza-associated hospitalization rates among persons aged ≥50 years observed during these two seasons.
Vaccination remains the best method for preventing influenza virus infection and its complications. Influenza vaccination can prevent influenza infections from strains that are sensitive or resistant to antiviral medications. Thus far this season, all the influenza A viruses that have been characterized, including oseltamivir-resistant (H1N1) viruses, are antigenically related to the components in the vaccine. However, approximately 80% of influenza B viruses tested are from a distinct lineage that is not related to the vaccine strain. Limited or no protection is expected when the vaccine and circulating virus strains are from different lineages (8,9). The composition of the 2009–10 influenza vaccine includes the same influenza A (H1N1 and H3N2) components, and a change in the influenza B component from the Yamagata to the Victoria lineage.
Influenza surveillance reports for the United States are posted weekly online at http://www.cdc.gov/flu/weekly/flu
activity.htm during the influenza season from October to mid-May. Additional information regarding influenza viruses, influenza surveillance, the influenza vaccine, and avian influenza is available at http://www.cdc.gov/flu.
Acknowledgments
This report is based, in part, on data contributed by participating state and territorial health departments and state public health laboratories, World Health Organization collaborating laboratories, National Respiratory and Enteric Virus Surveillance System collaborating laboratories, the U.S. Outpatient ILI Surveillance Network, the Emerging Infections Program, the New Vaccine Surveillance Network, the Influenza Associated Pediatric Mortality Surveillance System, and the 122 Cities Mortality Reporting System.
If you are interested in this further, I suggest you go to this site & look beyond “References” since WP keeps refusing to post further parts of this comment…sigh…


https://web.archive.org/web/20111015082635/http://www.cdc.gov/mmwr/preview/mmwrhtml/mm5814a4.htm
perhaps I can get the figures to show below, but go to the site to see the table if interested…
FIGURE 1. Number (N = 24,793) and percentage of respiratory specimens testing positive for influenza reported by World Health Organization and National Respiratory and Enteric Virus Surveillance System collaborating laboratories, by type, and surveillance week – United States, September 28, 2008-April 4, 2009
Number (N = 24,793) and percentage of respiratory specimens testing positive for influenza reported by World Health Organization and National Respiratory and Enteric Virus Surveillance System collaborating laboratories, by type, and surveillance week – United States, September 28, 2008-April 4, 2009
FIGURE 2. Percentage of visits for influenza-like illness (ILI) reported by U.S. Outpatient Influenza-like Illness Surveillance Network (ILINet), by surveillance week – United States, September 28, 2008-April 4, 2009 and 2006-07 and 2007-08 influenza seasons
Percentage of visits for influenza-like illness (ILI) reported by U.S. Outpatient Influenza-like Illness Surveillance Network (ILINet), by surveillance week – United States, September 28, 2008-April 4, 2009 and 2006-07 and 2007-08 influenza seasons
* The 2006-07 and 2007-08 seasons did not have a week 53; therefore the week 53 data point for those seasons is an average of weeks 52 and 1.
† The national and regional baselines are the mean percentage of visits for ILI during noninfluenza weeks for the previous three seasons plus two standard deviations. A noninfluenza week is a week during which <10% of specimens tested positive for influenza. National and regional percentages of patient visits for ILI are weighted on the basis of state population. Use of the national baseline for regional data is not appropriate.
FIGURE 3. Cumulative laboratory-confirmed influenza hospitalization rates,* by age group† and surveillance week – Emerging Infections Program, United States, October 1, 2008-March 28, 2009, and preceding three influenza seasons
Cumulative laboratory-confirmed influenza hospitalization rates,* by age group† and surveillance week – Emerging Infections Program, United States, October 1, 2008-March 28, 2009, and preceding three influenza seasons
* Per 10,000 population.
† Scales differ among age groups.
hopefully you can all see this one…blessings!
Using that archived CDC site that “they” seem to want to keep hidden found here:
https://web.archive.org/web/20111015082635/http://www.cdc.gov/mmwr/preview/mmwrhtml/mm5814a4.htm
Here are some further thoughts & links of potential interest…
I wonder if part of why this particular season was hidden was because of the final chart showing multiple seasons in comparison…
The 2008-2009 flu season data was still available here, but there were no Q & As, unlike every other year accessible from this page:
https://web.archive.org/web/20160414192006/http://www.cdc.gov:80/flu/pastseasons/
This link discusses 2009-2010 flu season & refers to the previous season
https://web.archive.org/web/20150207121642/http://www.cdc.gov/flu/pastseasons/0910season.htm
This one has data about the 2009 H1N1 PANDEMIC…
https://web.archive.org/web/20150206004704/http://www.cdc.gov/h1n1flu/
This represents the last capture of that page before its 8-1810 update:
https://web.archive.org/web/20100715010537/http://www.cdc.gov/h1n1flu/
Here are images of the H1N1 virus that bears remarkable similarity, in certain respects to the coronavirus
https://web.archive.org/web/20100715140242/http://www.cdc.gov/h1n1flu/images.htm
Numerous reports here:
https://web.archive.org/web/20100803093548/http://www.cdc.gov/h1n1flu/pubs/
lots of pandemic info for H1N1 here
https://web.archive.org/web/20100803093701/http://www.cdc.gov/h1n1flu/related_links.htm
The 2009 H1N1 Pandemic: Summary Highlights, April 2009-April 2010
https://web.archive.org/web/20100715132743/http://www.cdc.gov/h1n1flu/cdcresponse.htm
well, I’m running out of gas so will let this stand “as is” forgive my feet of clay please…Blessings!
Thank you, Valerie.
YW I hope something there interests someone who’s more in the know of this stuff than me… Blessings! 🙂
Part 2 of my previous comment…
References
Food and Drug Administration. Influenza virus vaccine 2009–2010 season. Available at http://www.fda.gov/cber/flu/flu2009.htm.
CDC. Influenza activity—United States and worldwide, September 28–November 29, 2008. MMWR 2008;57:1329–32.
CDC. Influenza activity—United States, September 28, 2008–January 31, 2009. MMWR 2009;58:115–9.
Finelli L, Fiore A, Dhara R, et al. Influenza-associated pediatric mortality in the United States: increase of Staphylococcus aureus coinfection. Pediatrics 2008;122:805–11.
CDC. Recommendations of the Advisory Committee on Immunization Practices (ACIP), 2008. MMWR 2008;57(No. RR-7).
CDC. CDC issues interim recommendations for the use of influenza antiviral medications in the setting of oseltamivir resistance among circulating influenza A (H1N1) viruses, 2008–09 influenza season. Atlanta, GA: US Department of Health and human services, CDC; 2008. Available at http://www2a.cdc.gov/han/archivesys/viewmsgv.asp?alertnum=00279.
Thompson WW, Shay DK, Weintraub E, et al. Mortality associated with influenza and respiratory syncytial virus in the United States. JAMA 2003;289:179–86.
Belongia E, Kieke B, Donahue J, et al. Effectiveness of inactivated influenza vaccines varied substantially with antigenic match from the 2004–2005 season to the 2006–2007 season. J Infect Dis 2009;199:159–67.
Skowronski D, De Serres G, Dickinson J, et al. Component-specific effectiveness of trivalent influenza vaccine as monitored through a sentinel surveillance network in Canada, 2006–2007. J Infect Dis 2009;199:168–79.
* The CDC influenza surveillance system collects five categories of information from nine data sources: 1) viral surveillance (World Health Organization collaborating U.S. laboratories, the National Respiratory and Enteric Virus Surveillance System, and novel influenza A virus case reporting), 2) outpatient illness surveillance (U.S. Outpatient ILI Surveillance Network), 3) mortality (122 Cities Mortality Reporting System and influenza-associated pediatric mortality reports), 4) hospitalizations (Emerging Infections Program and New Vaccine Surveillance Network), and 5) summary of geographic spread of influenza (state and territorial epidemiologist reports).
† Levels of activity are 1) no activity; 2) sporadic: isolated laboratory-confirmed influenza cases or a laboratory-confirmed outbreak in one institution, with no increase in influenza-like illness (ILI) activity; 3) local: increased ILI, or at least two institutional outbreaks (ILI or laboratory-confirmed influenza) in one region with recent laboratory evidence of influenza in that region; virus activity no greater than sporadic in other regions; 4) regional: increased ILI activity or institutional outbreaks (ILI or laboratory-confirmed influenza) in at least two but less than half of the regions in the state with recent laboratory evidence of influenza in those regions; and 5) widespread: increased ILI activity or institutional outbreaks (ILI or laboratory-confirmed influenza) in at least half the regions in the state with recent laboratory evidence of influenza in the state.
§ Defined as a temperature of ≥100.0°F (≥37.8°C), oral or equivalent, and cough and/or sore throat, in the absence of a known cause other than influenza.
¶ The national and regional baselines are the mean percentage of visits for ILI during noninfluenza weeks for the previous three seasons plus two standard deviations. A noninfluenza week is a week during which <10% of specimens tested positive for influenza. National and regional percentages of patient visits for ILI are weighted on the basis of state population. Use of the national baseline for regional data is not appropriate.
** The seasonal baseline proportion of pneumonia and influenza deaths is projected using a robust regression procedure in which a periodic regression model is applied to the observed percentage of deaths from pneumonia and influenza that were reported by the 122 Cities Mortality Reporting System during the preceding 5 years. The epidemic threshold is 1.645 standard deviations above the seasonal baseline.
†† NVSN conducts surveillance in Monroe County, New York; Hamilton County, Ohio; and Davidson County, Tennessee. NVSN provides population-based estimates of laboratory-confirmed influenza hospitalization rates in children aged <5 years admitted to NVSN hospitals with fever or respiratory symptoms. Children are prospectively enrolled, and respiratory samples are collected and tested by viral culture and reverse transcription-polymerase chain reaction (RT-PCR). EIP currently conducts surveillance for laboratory-confirmed, influenza-related hospitalizations in 61 counties and Baltimore, Maryland. The EIP catchment area includes 13 metropolitan areas: San Francisco, California; Denver, Colorado; New Haven, Connecticut; Atlanta, Georgia; Baltimore, Maryland; Minneapolis/St. Paul, Minnesota; Albuquerque, New Mexico; Las Cruces, New Mexico; Santa Fe, New Mexico; Albany, New York; Rochester, New York; Portland, Oregon; and Nashville, Tennessee. Hospital laboratory, admission, and discharge databases, and infection-control logs are reviewed to identify persons with a positive influenza test (i.e., viral culture, direct fluorescent antibody assays, RT-PCR, serology, or a commercial rapid antigen test) from testing conducted as part of their routine care.
FIGURE 1. Number (N = 24,793) and percentage of respiratory specimens testing positive for influenza reported by World Health Organization and National Respiratory and Enteric Virus Surveillance System collaborating laboratories, by type, and surveillance week – United States, September 28, 2008-April 4, 2009
Number (N = 24,793) and percentage of respiratory specimens testing positive for influenza reported by World Health Organization and National Respiratory and Enteric Virus Surveillance System collaborating laboratories, by type, and surveillance week – United States, September 28, 2008-April 4, 2009
Return to top.
2nd attempt at Part 2 following my comment above
References
Food and Drug Administration. Influenza virus vaccine 2009–2010 season. Available at http://www.fda.gov/cber/flu/flu2009.htm.
CDC. Influenza activity—United States and worldwide, September 28–November 29, 2008. MMWR 2008;57:1329–32.
CDC. Influenza activity—United States, September 28, 2008–January 31, 2009. MMWR 2009;58:115–9.
Finelli L, Fiore A, Dhara R, et al. Influenza-associated pediatric mortality in the United States: increase of Staphylococcus aureus coinfection. Pediatrics 2008;122:805–11.
CDC. Recommendations of the Advisory Committee on Immunization Practices (ACIP), 2008. MMWR 2008;57(No. RR-7).
CDC. CDC issues interim recommendations for the use of influenza antiviral medications in the setting of oseltamivir resistance among circulating influenza A (H1N1) viruses, 2008–09 influenza season. Atlanta, GA: US Department of Health and human services, CDC; 2008. Available at http://www2a.cdc.gov/han/archivesys/viewmsgv.asp?alertnum=00279.
Thompson WW, Shay DK, Weintraub E, et al. Mortality associated with influenza and respiratory syncytial virus in the United States. JAMA 2003;289:179–86.
Belongia E, Kieke B, Donahue J, et al. Effectiveness of inactivated influenza vaccines varied substantially with antigenic match from the 2004–2005 season to the 2006–2007 season. J Infect Dis 2009;199:159–67.
Skowronski D, De Serres G, Dickinson J, et al. Component-specific effectiveness of trivalent influenza vaccine as monitored through a sentinel surveillance network in Canada, 2006–2007. J Infect Dis 2009;199:168–79.
* The CDC influenza surveillance system collects five categories of information from nine data sources: 1) viral surveillance (World Health Organization collaborating U.S. laboratories, the National Respiratory and Enteric Virus Surveillance System, and novel influenza A virus case reporting), 2) outpatient illness surveillance (U.S. Outpatient ILI Surveillance Network), 3) mortality (122 Cities Mortality Reporting System and influenza-associated pediatric mortality reports), 4) hospitalizations (Emerging Infections Program and New Vaccine Surveillance Network), and 5) summary of geographic spread of influenza (state and territorial epidemiologist reports).
† Levels of activity are 1) no activity; 2) sporadic: isolated laboratory-confirmed influenza cases or a laboratory-confirmed outbreak in one institution, with no increase in influenza-like illness (ILI) activity; 3) local: increased ILI, or at least two institutional outbreaks (ILI or laboratory-confirmed influenza) in one region with recent laboratory evidence of influenza in that region; virus activity no greater than sporadic in other regions; 4) regional: increased ILI activity or institutional outbreaks (ILI or laboratory-confirmed influenza) in at least two but less than half of the regions in the state with recent laboratory evidence of influenza in those regions; and 5) widespread: increased ILI activity or institutional outbreaks (ILI or laboratory-confirmed influenza) in at least half the regions in the state with recent laboratory evidence of influenza in the state.
§ Defined as a temperature of ≥100.0°F (≥37.8°C), oral or equivalent, and cough and/or sore throat, in the absence of a known cause other than influenza.
¶ The national and regional baselines are the mean percentage of visits for ILI during noninfluenza weeks for the previous three seasons plus two standard deviations. A noninfluenza week is a week during which <10% of specimens tested positive for influenza. National and regional percentages of patient visits for ILI are weighted on the basis of state population. Use of the national baseline for regional data is not appropriate.
** The seasonal baseline proportion of pneumonia and influenza deaths is projected using a robust regression procedure in which a periodic regression model is applied to the observed percentage of deaths from pneumonia and influenza that were reported by the 122 Cities Mortality Reporting System during the preceding 5 years. The epidemic threshold is 1.645 standard deviations above the seasonal baseline.
†† NVSN conducts surveillance in Monroe County, New York; Hamilton County, Ohio; and Davidson County, Tennessee. NVSN provides population-based estimates of laboratory-confirmed influenza hospitalization rates in children aged <5 years admitted to NVSN hospitals with fever or respiratory symptoms. Children are prospectively enrolled, and respiratory samples are collected and tested by viral culture and reverse transcription-polymerase chain reaction (RT-PCR). EIP currently conducts surveillance for laboratory-confirmed, influenza-related hospitalizations in 61 counties and Baltimore, Maryland. The EIP catchment area includes 13 metropolitan areas: San Francisco, California; Denver, Colorado; New Haven, Connecticut; Atlanta, Georgia; Baltimore, Maryland; Minneapolis/St. Paul, Minnesota; Albuquerque, New Mexico; Las Cruces, New Mexico; Santa Fe, New Mexico; Albany, New York; Rochester, New York; Portland, Oregon; and Nashville, Tennessee. Hospital laboratory, admission, and discharge databases, and infection-control logs are reviewed to identify persons with a positive influenza test (i.e., viral culture, direct fluorescent antibody assays, RT-PCR, serology, or a commercial rapid antigen test) from testing conducted as part of their routine care.
THINK ABOUT IT…..
The UK no longer has private testing labs to fall back upon at this time.
I’d hate to think what the US would have done without our private labs which are performing 10 TIMES more tests than our State Dept of Health labs.
3rd attempt at Part 2 of my comment above…
References
Food and Drug Administration. Influenza virus vaccine 2009–2010 season. Available at http://www.fda.gov/cber/flu/flu2009.htm.
CDC. Influenza activity—United States and worldwide, September 28–November 29, 2008. MMWR 2008;57:1329–32.
CDC. Influenza activity—United States, September 28, 2008–January 31, 2009. MMWR 2009;58:115–9.
Finelli L, Fiore A, Dhara R, et al. Influenza-associated pediatric mortality in the United States: increase of Staphylococcus aureus coinfection. Pediatrics 2008;122:805–11.
CDC. Recommendations of the Advisory Committee on Immunization Practices (ACIP), 2008. MMWR 2008;57(No. RR-7).
CDC. CDC issues interim recommendations for the use of influenza antiviral medications in the setting of oseltamivir resistance among circulating influenza A (H1N1) viruses, 2008–09 influenza season. Atlanta, GA: US Department of Health and human services, CDC; 2008. Available at http://www2a.cdc.gov/han/archivesys/viewmsgv.asp?alertnum=00279.
Thompson WW, Shay DK, Weintraub E, et al. Mortality associated with influenza and respiratory syncytial virus in the United States. JAMA 2003;289:179–86.
Belongia E, Kieke B, Donahue J, et al. Effectiveness of inactivated influenza vaccines varied substantially with antigenic match from the 2004–2005 season to the 2006–2007 season. J Infect Dis 2009;199:159–67.
Skowronski D, De Serres G, Dickinson J, et al. Component-specific effectiveness of trivalent influenza vaccine as monitored through a sentinel surveillance network in Canada, 2006–2007. J Infect Dis 2009;199:168–79.
* The CDC influenza surveillance system collects five categories of information from nine data sources: 1) viral surveillance (World Health Organization collaborating U.S. laboratories, the National Respiratory and Enteric Virus Surveillance System, and novel influenza A virus case reporting), 2) outpatient illness surveillance (U.S. Outpatient ILI Surveillance Network), 3) mortality (122 Cities Mortality Reporting System and influenza-associated pediatric mortality reports), 4) hospitalizations (Emerging Infections Program and New Vaccine Surveillance Network), and 5) summary of geographic spread of influenza (state and territorial epidemiologist reports).
† Levels of activity are 1) no activity; 2) sporadic: isolated laboratory-confirmed influenza cases or a laboratory-confirmed outbreak in one institution, with no increase in influenza-like illness (ILI) activity; 3) local: increased ILI, or at least two institutional outbreaks (ILI or laboratory-confirmed influenza) in one region with recent laboratory evidence of influenza in that region; virus activity no greater than sporadic in other regions; 4) regional: increased ILI activity or institutional outbreaks (ILI or laboratory-confirmed influenza) in at least two but less than half of the regions in the state with recent laboratory evidence of influenza in those regions; and 5) widespread: increased ILI activity or institutional outbreaks (ILI or laboratory-confirmed influenza) in at least half the regions in the state with recent laboratory evidence of influenza in the state.
Re-posting the initial comment in a thread from yesterday, in case this sparks any other ideas…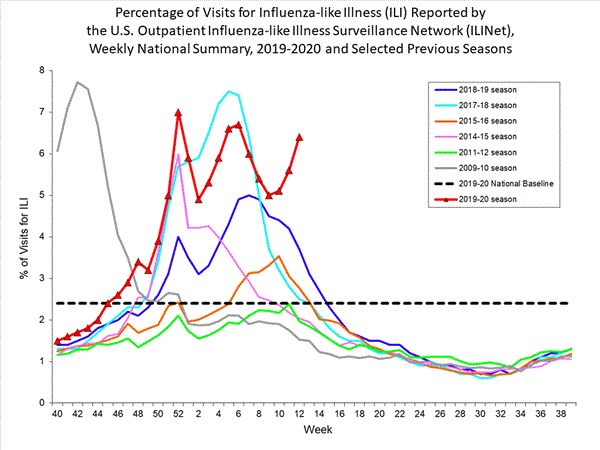
https://wqth.wordpress.com/2020/04/01/20200401-coronacrisis-china-virus-daily-thread/comment-page-2/#comment-449564
Following that post referenced above I share charts from the CDC for all the flu seasons NOT shown on the comparative graph if anyone else might be interested in that data…
Repeat Comment Follows NOW…
This may be way off base, but your first graph above shows an interesting pattern…
In Trump’s Time, on the scene or in office, the patterns are pretty different than preceding years. By the way, why didn’t they plot data for 2010-2011 or 2012-2013 or 2013-2014 or 2016-2017 seasons…What Are They Hiding Here???
2011-2012 is also a leading into an election season & it shows the two humps perspective, could the CCP have been testing out a less virulent form here to then use to leverage BHO?
2015-2016 is leading into the Trump election & it also overlaps the Coup Machinations like Crossfire Hurricane, Steele/Clinton dossier, Manafort situations, Michael Flynn takedown ops likely planned…it’s worse than the 2011-2012 scenario but a similar pattern…
2017-2018 is leading into Mid-term elections & the peak is higher than other years besides the Usurper’s Swine Flu 2009-2010 season which peaked much earlier than the other shown “Flu” seasons. It didn’t have the double hump that the other Trumpian seasons displayed…
2018-2019 is another non-election year but displays the double hump form that May be representative of more Chi-Com viral tampering.
Oh, these are “visits for flu-like illnesses” so what if all the Trump Deranged are more immunocompromised purely from their overwhelming fears about the direction of the nation under Trump’s leadership so they get sicker easier or go to the Dr more because of general neurosis?
2007-2008 & 2008-2009 seasons on display could also be instructive too to see if similar patterns were presenting in the lead up to BHO’s usurpation, especially because Hillary was an electoral factor up until Barry was “anointed” to be the dem’s candidate…
That should help. UGH!
======
Shenzhen becomes first Chinese city to ban consumption of cats, dogs
The Chinese metropolis of Shenzhen has become the first city in the country to ban the sale and consumption of cat and dog meat amid the coronavirus pandemic, according to a report.
https://nypost.com/2020/04/02/shenzhen-is-first-in-china-to-ban-consumption-of-cats-dogs/
the coronavirus spread very quickly to other countries…but China got it right off the bat.
(ugh)
Here is an interesting comparative graph that gives helpful verbal descriptions of the years shown…& here’s the more recent graph to compare to
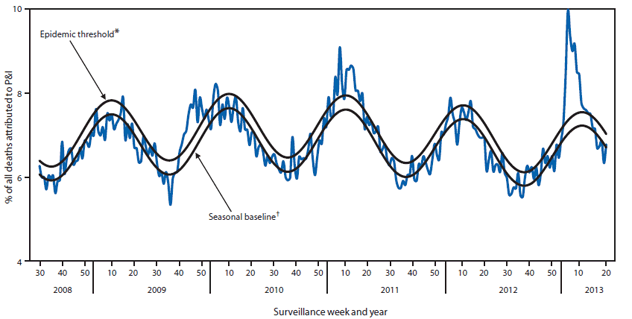
some of the 2012-2013 info
FIGURE 2. Percentage of visits for influenza-like illness (ILI)* reported to CDC, by surveillance week and year — U.S. Outpatient Influenza-Like Illness Surveillance Network, United States, September 30, 2012–May 18, 2013, and selected previous seasons
* Defined as a temperature of ≥100.0°F (≥37.8°C), oral or equivalent, and cough or sore throat, in the absence of a known cause other than influenza.
† The national baseline is the mean percentage of visits for ILI during noninfluenza weeks for the previous three seasons plus two standard deviations. A noninfluenza week is defined as periods of two or more consecutive weeks in which each week accounted for <2% of the season's total number of specimens that tested positive for influenza. Use of the national baseline for regional data is not appropriate.
Alternate Text: The figure above shows the percentage of visits for influenza-like illness (ILI) reported to CDC, by surveillance week and year in the United States during September 30, 2012-May 18, 2013, and selected previous seasons. Nationally, the weekly percentage of outpatient visits for ILI to health-care providers participating in the U.S. Outpatient Influenza-Like Illness Surveillance Network exceeded the national baseline level of 2.2% for 15 weeks during the 2012-13 influenza season.
FIGURE 4. Percentage of all deaths attributable to pneumonia and influenza (P&I), by surveillance week and year — 122 Cities Mortality Reporting System, United States, 2008–May 18, 2013
* The epidemic threshold is 1.645 standard deviations above the seasonal baseline.
† The seasonal baseline is projected using a robust regression procedure that applies a periodic regression model to the observed percentage of deaths from P&I during the preceding 5 years.
Alternate Text: The figure above shows percentage of all deaths attributable to pneumonia and influenza (P&I), by surveillance week and year in 122 U.S. cities during 2008-May 18, 2013. The percentage of deaths attributed to P&I peaked at 9.9% during the week ending January 19, 2013 (week 3). From the 2008-09 season through the 2011-12 season, the peak percentage of P&I deaths ranged from 7.9% to 9.1%, and the total number of consecutive weeks at or above the epidemic threshold ranged from 1 to 13.
Here is an interesting comparative graph that gives helpful verbal descriptions of the years shown…& here’s the more recent graph to compare to
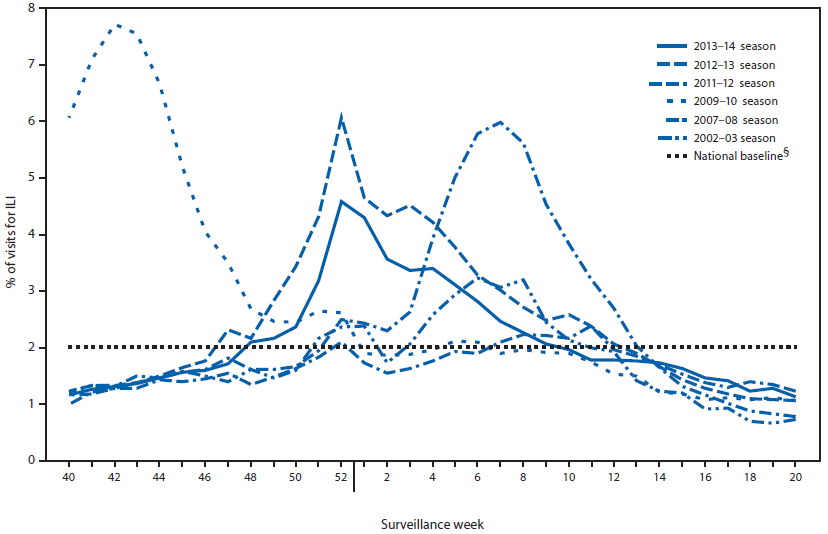
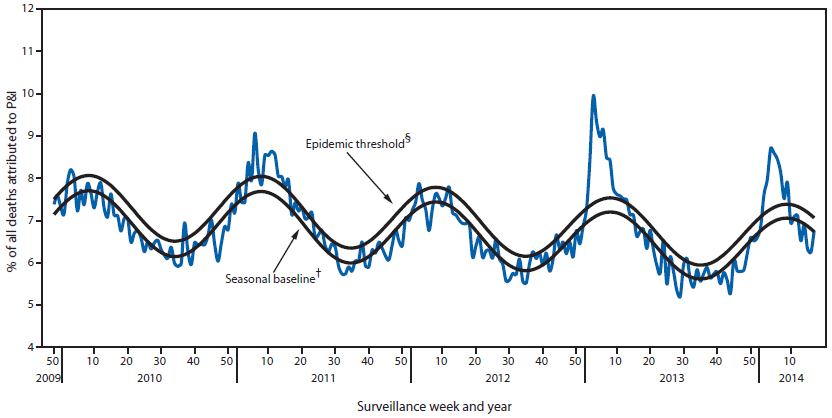
some of the 2013-2014 info
FIGURE 2. Percentage of visits for influenza-like illness (ILI)* reported to CDC, by surveillance week — Outpatient Influenza-Like Illness Surveillance Network, United States, 2013–14 influenza season and selected previous seasons†
* Defined as a fever of ≥100.0°F (≥37.8°C), oral or equivalent, and cough or sore throat, in the absence of a known cause other than influenza.
† Data as of May 30, 2014.
§ The national baseline is the mean percentage of visits for ILI during weeks with little or no influenza virus circulation (noninfluenza periods) for the previous three seasons plus two standard deviations. A noninfluenza period is defined as ≥2 consecutive weeks in which each week accounted for <2% of the season's total number of specimens that tested positive for influenza. Use of the national baseline for regional data is not appropriate.
Alternate Text: The figure above shows the percentage of visits for influenza-like illness (ILI) reported to CDC, by surveillance week and year in the United States during the 2013-14 influenza season and selected previous seasons. Nationally, the weekly percentage of outpatient visits for ILI to health-care providers participating in the U.S. Outpatient Influenza-Like Illness Surveillance Network was at or above the national baseline level of 2.0% for 15 consecutive weeks during the 2013-14 influenza season.
FIGURE 4. Percentage of all deaths attributable to pneumonia and influenza (P&I), by surveillance week and year — 122 Cities Mortality Reporting System, United States, 2009–2014*
* Data as of May 30, 2014.
† The seasonal baseline proportion of P&I deaths is projected using a robust regression procedure, in which a periodic regression model is applied to the observed percentage of deaths from P&I reported by the 122 Cities Mortality Reporting System during the preceding 5 years.
§ The epidemic threshold is set at 1.645 standard deviations above the seasonal baseline.
Alternate Text: The figure above shows the percentage of all deaths attributable to pneumonia and influenza (P&I), by surveillance week and year in 122 U.S cities during 2008-2014. During the 2013-14 influenza season, the percentage of deaths attributed to P&I exceeded the epidemic threshold for 8 consecutive weeks from January 11, 2014 to March 1, 2014 (weeks 2-9). The percentage of deaths attributed to P&I peaked at 8.7% during the week ending January 25, 2014 (week 4).
Hey, Cabal peeps, beware of twitter personalities who can actually do math.
https://twitter.com/mitchellvii/status/1245689987603009536
We have 215,244 Americans who have tested positive for COVID-19. But we also hear up to 94% of tests come back negative.
https://wpr.org/heres-why-so-many-covid-19-tests-are-coming-back-negative
This would equal 3,587,400 tests given to get 215,244 positives.
But only 1 million tests have been given.
Someone is lying.
Well, maybe.
What this is more likely to indicate is that 3.5 million are actually infected.
And 2.5 million were not tested.
Because only those who presented symptoms were tested.
Again, a bigger denominator than is being presented because we have inaccurate numbers. .
Which is why all the big numbers for this thrown around are really just guesses.
Yep, you’re right about that.
News every night is focused on numbers. But they mean nothing.
Wait, actually they do mean something. They present a false impression.
EXACTLY! TY> As I have been saying ad nauseum
Here is an interesting comparative graph that gives helpful verbal descriptions of the years shown…& here’s the more recent graph to compare to
some of the 2016-2017 info
FIGURE 3. Percentage of visits for influenza-like illness (ILI)* reported to CDC, by surveillance week — Outpatient Influenza-Like Illness Surveillance Network, United States, 2016–17 influenza season and selected previous influenza seasons†
* Defined as fever (temperature ≥100.0°F [≥37.8°C], oral or equivalent) and cough and/or sore throat, without a known cause other than influenza.
† As of June 9, 2017.
Interesting that this year they don’t have a “Figure 4” & they also list someone with a conflict of interest:
“Conflict of Interest
Jacquline Katz reports U.S. Patent 6,196,175 (issued 01/02/2001) and U.S. Patent 8,163,545 (issued 4/26/2012). No other conflicts of interest were reported.
Top
Corresponding author: Lenee Blanton, lblanton@cdc.gov, 404–639–3747.”
Here is an interesting comparative graph that gives helpful verbal descriptions of the years shown…& here’s the more recent graph to compare to
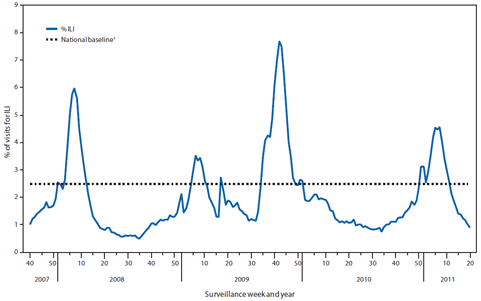
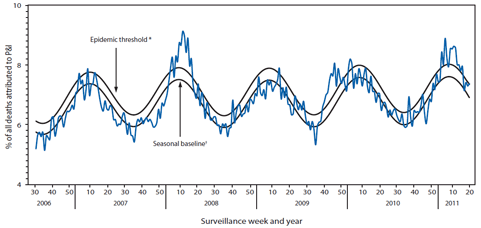
some of the 2010-2011 info
FIGURE 2. Percentage of outpatient visits for influenza-like illness (ILI) reported, by surveillance week and year — U.S. Outpatient Influenza-Like Illness Surveillance Network (ILINet), United States, September 30, 2007–May 21, 2011*
* As of May 25, 2010.
† The national and regional baselines are the mean percentage of visits for ILI during noninfluenza weeks for the previous three seasons, plus two standard deviations. A noninfluenza week is a week during which <10% of specimens tested positive for influenza. National and regional percentages of patient visits for ILI are weighted on the basis of state population. Use of the national baseline for regional data is not appropriate.
Alternate Text: The figure above shows the percentage of outpatient visits for influenza-like illness (ILI) reported, by surveillance week and year in the United States from September 30, 2007-May 21, 2011, according to the U.S. Outpatient Influenza-Like Illness Surveillance Network (ILINet). The weekly percentage of outpatient visits for ILI to the U.S. Outpatient Influenza-like Illness Surveillance Network (ILINet) exceeded national baseline levels (2.5%) during the weeks ending December 25, 2010, through March 19, 2011 (weeks 51-11), and peaked at 4.6% during the week ending February 19, 2011 (week 7).
FIGURE 4. Percentage of all deaths attributed to pneumonia and influenza (P&I), by surveillance week and year —122 Cities Mortality Reporting System, United States, 2006–2011
* The epidemic threshold is1.645 standard deviations above the seasonal baseline.
† The seasonal baseline is projected using a robust regression procedure that applies a periodic regression model to the observed percentage of deaths from P&I during the preceding 5 years.
Alternate Text: The figure above shows the percentage of all deaths attributed to pneumonia and influenza (P&I) by surveillance week and year in the United States from 2006-2011, according to the Mortality Reporting Systems of 122 cities. During the 2010-11 influenza season, the percentage of deaths attributed to P&I exceeded the epidemic threshold for 13 consecutive weeks, from the weeks ending January 29 to April 23, 2011 (weeks 4-16).
Okay, I will raise my hand and claim ignorance.
Help me out here, Valerie.
What is it that I’m supposed to take out of these graphs.
Difference between flu seasons.
I’m confused
You are super familiar with them. Can you explain it to me?
I was suspicious of the CDC multi-colored graph that kept getting posted, as in why didn’t it include All Available Years from 2009-10 through 2019-20–were they hiding something? So I went to the CDC to look up the missing years…here’s how I shared it w/ GC…
https://wqth.wordpress.com/2020/04/01/20200401-coronacrisis-china-virus-daily-thread/comment-page-2/#comment-449564
“OK, so I attempted to go to the source cdc.gov to see if there was other data available for the “hidden” seasons on the line graph you shared. This site deals with historic flu data
https://www.cdc.gov/flu/season/past-flu-seasons.htm
It starts with 2006-2007 & goes to 2018-2019 but is conspicuously missing 2008-2009 hmm…
If I can find decent summary data for the “missing” seasons on your line graph I will attempt to share”
It may be Nothing but I think it’s odd that they don’t show Every Year to compare trends. Finding the 2008-2009 data really took some digging, perhaps because it overlaps BHO’s pandemic pooch screw…
I shared the graphs from the “missing” (not selected for inclusion by the CDC?) years on the above graph that showed multi-year trends…
I didn’t read all the CDC reports over those years which May have contained some type of explanation why they are Only Graphing Selected Years. It could be important or it could be a (white) rabbit trail…I’m getting sleep deprived so could be wasting my & other’s time or could have tripped over a diamond in the rough, but someone else’s analysis will likely reveal its facets better than I might.
Hope that helps a bit…Blessings!
Sorry for so many “similar” posts…if the data is important someone might see the trends from the visuals & run with it…perhaps!
I get it now
Makes perfect sense. YES, you were right to be curious about missing years. Sharp eye, Valerie.
Get some rest.
Luv ya!
Thanks, Daughn. No sleep for me (yet)…Love to you too! I’d do a heart emoji if I knew how 🙂
The medicine combo of Plaquenil and Zithromax works on other flu-like virues, not just COVID-19. There is treatment for flu that had been covered up, so vaccine and research money for flu shot is NOT needed.
No wonder the deep staters want to suppress that success…
And if it treats regular flu cheaper than Tamiflu……🤔
IMPORTANT POST by E.m. Smith aka ChiefIO
States, Counties, Cities, Personal – You Are On Self Rescue Now
LOTS MORE VERY GOOD INFO!!
And do not miss the comments.
This comment may be of interest:
That’s a great point about masks. I have yet to see any checkout clerks wearing them. However, a lot of grocery stores here are putting a sheet of plexiglass between the checkout stand and the customer.
Why not just microwave it for 30-45 seconds?
pgroup,
There is a major discussion by the engineer/scientist types at ChiefIOs on microwaves and masks. Wavelengths and vibrational modes of H2O and all that.
Starts here:
https://chiefio.wordpress.com/2020/03/31/states-counties-cities-personal-you-are-on-self-rescue-now/#comment-127614
Morning Treepers. I was suspicious, but NOT sure till yesterday. Fauchi IS the turd in the punchbowl, the ENEMY within. This is ALL because of him and his reliance on PROJECTIONS instead of facts. When he went against Trump on Chloroquine + Azithromycin, I was suspicious, and I watched, he even BULLIED Birx into the doom and gloom predictions. But yesterday SEALED it. He blatantly went against the cheap, readily available, and EASY antibody test. Saying it was not high on his priorities.
WHAT? He cannot be serious, the ONLY way to know what we are facing ACCURATELY, and to PREVENT further attack (herd immunity) IS the antibody test. Birx KNOWs IT, and OPENLY contradicted Fauchi. She knows the ONLY way to get a TRUE picture, you MUST know the denominator, the TRUE number of infected, ESPECIALLY those that recovered.
See, Fauchi is ALL IN on the projections, and waiting a YEAR AND A HALF for a vaccine that MAY or MAY NOT work. HE is the problem. He KNOIWS Chloroquine is a cure, and a DAMN good and safe one, it is also CHEAP and reliable, byt THAT would make a 4 billion or more vaccine moot, must dead pan that.
He also KNOWS, yes he KNOWSS the projections are CRAP, I would not doubt he KNOWS, and is surpressing key FACTS from Trump on the REAL start date of first infection, AND the massive amount of infected and recovered therein. But see, if we were infected MUCH earlier, as I said, and MUCH more widespread than believed, and “reported” that would mean that, as I also said, MANY already recovered and did not even know they had it due to the 80% mild symptoms, they chalked it up to something ELSE.
But, Dr Doom, er Fauchi, can’t have that, knowing the TRUE number of infected AND recovered KILLS BOTH the projection narrative, AND the rush for his 4 billion dollar vaccine.
That is what this ALL is about. Fauchi wants HIS weapon, and I am now calling this HIS weapon. He is CHEIF defender of it. Ask yourself WHY he who ORIGINALLY said, 5 days before Trump SHUT OFF travel to China, said that the covid 19 was no big deal, and NOTHING to worry about, but NOW he is ALL in, but ONLY if it HIDES the cure and TRUE nature of the virus.
And that IS what he is doing, while spreading DOOM and GLOOM numbers of hundreds of thousands of Americans DEAD. WHY? That is a PROJECTION, and A BAD one, and I do not mean bad as in dire, I mean bad as in WRONG, WAY WRONG.
Then, when there is a SURE way to mitigate this, Chloroquine +, and a SURE way to QUICKLY and CHEAPLY find the TRUE nature of the virus, Dr Doom goes out and scares the shit out of everyone, while DEAD PANNING two things that would HELP reduce his doom and gloom projection. WHY?
Dear President Trump, do NOT trust Fauchi, he is INTENTIONALLY misleading you. He either is incompetent, at 80 WAY past his prime, OR he has an agenda ( a $4,000,000,000 vaccine perhaps?) REPLACE (FIRE) Dr Fauchi, NOW, state it is for “health reasons” I don’t care get #35 out and get the BEST virologist in the WORLD or at LEAST someone in the top TEN here, and get this shit over. Fauchi is obfuscating, stalling, and waiting for his 4b vaccine.
People are suffering and DYING, and many more will not from this virus the longer you continue to listen to Dr Doom. He does NOT have America and Americans best interests at heart, he has his projections, his obstinance to CHANGE, and his WALLET at heart, Birx is TRYING to right the ship, and Fauchi and the MSM WILL try to bully her compliance or SILENCE again soon.
FIX the problem Mr. President. I KNOW you or someone close to you READS these blogs and posts, too many hints. DO IT. Get this under YOUR control. I KNOW you defer to the “expert” but experts make MISTAKES to, and you FIRE them. Were this guy an architect or an engineer and screwed up the numbers, you would not HESITATE.
Dr Doom is screwing up more than just the numbers, he is LETTING people suffer and die, to SELF FULFILL his projections. He is TRASHIN the economy, and he is SCARING the hell out of people. CUT THE CORD. Get some NEW blood. It is TIME.
The ONLY virus we’ve stopped with a vaccine is Hep C.
39 Million people dead from AIDS, almost 50yrs later, still no vaccine.
No vaccine for SARS
No vaccine for MERS
A vaccine for this COVID-19 is highly doubtful.
BINGO. TY! Plus we have something that actually DOES work, and Fauchi, er Dr Doom, is suppressing it.
Yep
Late last night this was posted:
ANNND NOW, after a reporter just HAPPENED to ask yesterday, bullshit..cough…, Fauchi is being given a SECURITY detail because he has had threats over his use of projections (ostensibly us deplorables). RIGHT on cue. ANOTHER self fulfilling strawman. They REALLY want their weapon, and Fauchi is the HEAD weapon deplorer. He is NOW going to be protected, and NOT just from “threats” from, they THINK, being FIRED. DO IT MR PRESIDENT, do it NOW.
Should have a caption:
Oh SHIT!
He KNOWS!
My goodness, Fauci could barely maintain. He was terrified.
At first it looked as if he was suppressing a smile or laugh, to me.
No money to be made in cures, only in reasearch and “failed” vaccines. Dr. Fauci said at the presser Mar 31 (or 30?), that if the vaccine fails, you take it off the table and start again. If an average of only 24% of the grant money actually goes into the research, and the rest is expenses, why would they want to close the spigot?
a sustainable “money pit” This guy MUST go, and GO NOW!.
Um, Bonnie and Clyde. HIV reasearch will be going away, per POTUS, in less than 9 years. Need another virus research program to keep that money flowing.
Polio, Tuberculosis, Measles, Hep B, Mumps, Rabies
Congressman Henry Waxman (D-CA), NIAID Director Anthony S. Fauci, M.D., Sir Elton John, U.S. Congresswoman Nancy Pelosi (D-CA) attend the Syringe Access Fund at the Open Society Foundations on July 24, 2012 in Washington, DC. (Michael Kovac / Getty Images.)
Fauci from the WikiLeaks e-mails.
CREDIT:
I did a bit of the digging.
>>>>>>>>>
From: Quam, Lois E
Sent: Thursday, November 03, 2011 02:14 PM
To: Abedin, Huma; Mills, Cheryl D
Subject: Tony Fauci
I thought you and the Secretary would enjoy knowing the Tony Fauci was just named by Government Executive magazine to be one of the top 20 federal government employees of all time.
*https://wikileaks.org/clinton-emails/emailid/25332
>>>>>>>>>
From: Mills, Cheryl D
Sent: Friday, July 20, 2012 10:04 PM
To: Subject: Fw: Sec. Clinton’s IAS speech
From: Fauci, Anthony (NIH/NIAID) [E] [mailto:AFAUCI@niaid.nih.gov]
Sent: Friday, July 20, 2012 10:00 PM
To: Daniel, Joshua J Cc: Mills, Cheryl D Subject:
RE: Sec. Clinton’s IAS speech Josh:
Thanks for sending the Secretary’s speech to me. It is really very good. I have no substantive comments. It will be very well received and it will follow very nicely my preceding plenary speech in which I speak about the scientific basis for the implementation of the interventions to which she refers in her speech.
Best regards, Tony [Fauci]
*https://wikileaks.org/clinton-emails/emailid/4601
The TURD just got stinkier..Dr DOOM, and the Cabal, settin in a tree.
Oh, yah REAL stinky he is so stinky he smells like Shiff.
I opened a Document on him to save the info.
I feel like retching. Those ugly, evil mugs.
More from WikiLeaks on Fauci
BACKGROUND
Zika virus is a mosquito-borne flavivirus that was first identified in Uganda in 1947 in monkeys. It was later identified in humans in 1952 in Uganda and the United Republic of Tanzania. Outbreaks did not occur outside of Africa until 2007, when it spread to the South Pacific. In early 2015, a widespread epidemic of Zika fever, caused by the Zika virus in Brazil, spread to other parts of South and North America.
The Zika virus finally arrived in the United States in 2016 (Illegals?)
CAN YOU SAY DDT???
The Cabal is quit to stomp on the notion. TIME: Why Bringing Back DDT to Fight Zika Mosquitoes Could Backfire
……
Pelosi and Fauci, the useless idiot Maxine Waters and the nasty witch Rosa DeLauro, who worked for ten years to get the food safety modernization act passed.
Notice they float the idea of a FEMA sort of fund for disease. It is the same thing we are hearing now.
*https://wikileaks.org/dnc-emails/emailid/13110
PELOSI — Remarks at House Democrats’ Steering & Policy Committee Hearing:
‘The Zika Public Health Crisis: the Urgent Need for the President’s Emergency Funding Request’
From: Democratic.Leader@mail.house.gov
Date: 2016-05-12 20:43
Subject: PELOSI — Remarks at House Democrats’ Steering & Policy Committee Hearing: ‘The Zika Public Health Crisis: the Urgent Need for the President’s Emergency Funding Request’
[cid:image001.jpg@01D00FCE.229082C0]
May 12, 2016
Contact: Drew Hammill/Evangeline George 202-226-7616[speech writter]
Pelosi Remarks at House Democrats’ Steering & Policy Committee Hearing:
‘The Zika Public Health Crisis: the Urgent Need for the President’s Emergency Funding Request’ Washington, D.C. –
Democratic Leader Nancy Pelosi delivered remarks today at House Democrats’ Steering & Policy Committee hearing entitled ‘The Zika Public Health Crisis: the Urgent Need for the President’s Emergency Funding Request’. Below are the Leader’s opening and closing remarks:
Leader Pelosi’s Opening Remarks
“Good afternoon, everyone. Thank you very much to our Members, especially, to our very special guests for joining us this afternoon on subject of great concerns to our great country. I am so grateful to the Co-Chairs of the Steering and Policy Committee, Congresswoman Rosa DeLauro and Congresswoman Donna Edwards for bringing us together this afternoon. It is my privilege now to call to order this hearing: ‘The Zika Public Health Crisis: the Urgent Need for the President’s Emergency Funding Request’.
“Every day, we learn more about the accelerating threat that the Zika virus presents to expectant mothers across the country. Every day, we lose valuable time needed to avert what could be a major public health emergency in communities across our country. And yet every day, this Congress refuses to provide the emergency resources needed to protect America’s families from this terrible virus.
“There are already more than 1,000 Americans – including more than 100 pregnant women – with confirmed cases of Zika; but House Republicans do nothing. Last month, Congress voted twice to block emergency resources to protect American communities from Zika. We refuse to stand idle. We will keep demanding action.
“Today, we are very honored to hear from a distinguished board of witnesses who stand on the front lines of the fight against Zika in our country. We are pleased to welcome Mayor Mitch Landrieu, Mayor of the City of New Orleans, Louisiana; Dr. Anthony Fauci, Director of the National Institute of Allergy and Infectious Diseases, some call him a hero – the NIH – and Dr. Anne Schuchat, a Principal Deputy Director, Centers for Disease Control.
“Our guests have a clearer perspective than anyone about how Congress’s dangerous refusal to address the threat of Zika in a timely way could have tragic consequences for America’s families. They will be more fully introduced by our distinguished Co-Chairs. And we all know that we must pass the President’s $1.9 billion emergency supplemental request – which the Congress has been obstructing for months.
“To the Congress we say: Do your job. Stop standing in the way of the emergency action we need to protect America’s families. Do your job. Join us in averting this frightening public health crisis. Do your job. Swiftly and fully-fund the President’s request for emergency funds to address the Zika threat in America.
“With appreciation to our special guests for their great service to our country and for their statements that they are presenting today, I am yielding to our distinguished co-Chair, Rosa DeLauro.
….
Leader Pelosi’s Closing Remarks
“I thank our Members – we had nearly 30 Members of the House of Representatives here for this hearing today, which is, in light of all of the things that are going on here, a very large number. We thank you all for coming. Thank you. Some of them are Ranking Members of committees – as is Maxine Waters. So, she has her own responsibilities and Financial Services. Some of them are Cardinals on Appropriations, as is [Congresswoman] Marcy Kaptur, where this discussion will continue, maybe tomorrow but certainly, next week. Thank you, Mr. [Steve] Cohen, for joining us as well.
“I thank all of our Members but especially, on behalf of all of our Members, I thank our witnesses for your very, very excellent and informed and valuable testimony today. It is a balance that we have to strike because we don’t want to instill fear, and yet we want to be prepared. And you have helped to channel our passions into some dispassionate approaches to get this done.
“Mr. Mayor, you talked about being the point of a spear if something hits or in anticipation – I love the word ‘anticipation.’ I wish everyone would anticipate. Right now, we have a challenge to get people to even respond right here, and I don’t know why.
“And you, Dr. Fauci, talked about reaching a point – if you don’t have enough money, if you have some money, and you get to a point in research, before you can go to the next point, you have to know that the resources are there. So, that’s why it’s very important for us to have your documentation, your justification for the funds that the Administration is asking for.
“And of course, we thank you, Dr. Schuchat, for what you have done with the CDC and others at the CDC. And you’re in charge of public health in our country. I really do think, as Mr. [Dan] Kildee suggested, there has to be a bigger look at this. Congresswoman DeLauro has been talking about and working, even trying in a bipartisan way, to develop a fund that is there so that it can be called upon – a bit similar to FEMA – that has to be replenished and the rest. I don’t know if that will be possible. It shouldn’t have to be possible; it should be clear that when there’s an emergency that we couldn’t have possibly have anticipated – Zika – back 18 months, 16 months, the beginning of this Congress, Zika. And yet now, for months, it has been an underfunded emergency, money coming from Ebola. And Ebola money is so necessary even if it is offshore, even if it’s in Africa because containing it there is important to humanity but it’s also from a practical standpoint, some people in our country a message that we can say that keeps us safer.
“You all in one way or another are involved in public health. And I really do think that the public health service, the public health delivery, is something that the American people don’t fully appreciate. And it’s such a spectacular manifestation of the public sector. It’s something that people cannot do for themselves, no matter how ‘Ayn Rand-ish’ they want to be. They just can’t do it for themselves. So, I think we also have to do – again, as Mr. Kildee was saying: how do we raise awareness of how important all of this is on a calm day much less on a day when we’re under threat. And maybe we can work together in a big-picture, longer term way to impress upon the public through public service announcements, whatever it is, speeches by public officials, all of you that you are there for the public health of every person in America.
“And when you look at those charts and you see the maps where it is – well, some people may say ‘I live in the North’ – as you said, Marcy [Kaptur] – ‘I live in the North, so it’s not affecting me.’ But every one of these people are our children. All of these children are our children. When Dr. Schuchat talked earlier, Maxine [Waters], about it might cost $10 million to care for a child who was affected by Zika. And that’s a child that might never be able to walk, talk, see, hear or anything, comprehend. But $10 million. I mean, the impact is much more of a concern than the [cost]. But it’s such a false dichotomy not to get ahead of this – we all know that it’s self-evident, but ever certainly, it is not that self-evident to some selves around here. And that’s what we have to, in a non-menacing way, get across. “So, I’m suggesting maybe in addition to some of the wonderful suggestions we have, something – following up on Dan when he said if there’s a fire, put out the fire; don’t talk about how this fire got started until after we put out the fire – that we have like a ‘break the glass’ kind of an approach to this. Break the glass. But when you break the glass, you have a solution right there. You have a solution. Somebody’s going to come, you’re going to spray – whatever it happens to be the word has gone out. So, I think we have to take the public to a different place.
“I’ve been thinking about this for a while – we go back so many decades, Dr. Fauci, on HIV/AIDS and then so many things after that. And thank you for your leadership. And as the mayor knows, I appreciate fully what he had to say about all of this and I’m sympathetic to – I’ve sat in on many meetings, hearings, awards ceremonies to know how important the public health service is to our country. I just want everybody to know that so when we’re asking for resources, we don’t have to say – of course we want a justification, I’m an appropriator. As we have an expression: it’s not the price, it’s the money. We always say: what you need we want you to have; now where are we going to get the money. You give us the justification for it so we can compete. But we shouldn’t have to compete. This should be an emergency, so thank you for hearing me out.
“I didn’t get a chance to ask questions so I’m abusing my privilege as Leader to expound. But that’s all to say how much we appreciate not only your testimony here but your leadership in your city and your region and at the NIH and at CDC and to our country. I’m going to yield to our co-Chairs to have the last word.”
Great work, but the puppet master pulling the strings on this was JUST revealed by big mouth Cuomo. They ALL, including Fauchi, are basing their projections on the IHME study founded and funded by BILL GATES. You know the one who JUST a few months ago had a conference that MOCKED almost this EXACT virus scenario. There ARE NO COINCIDENCES.
Gold Shovel Award!
Limbaugh just referred to it, 5 minutes ago. Limbaugh is right on the money about all of it. Has been drumming it all week that it has to end. Trump has to hear it – he monitors everything.
When this got WORSE, Rush was OFF the air. When this got better Fauchi was OFF the air. Coincidence? Dr Doom needs to GO!.
Great Digging!
(As Usual) 🙂
That means that Fauchi is not the preeminent virologist here, he is the preeminent F up here. #35 INDEED. Get someone BETTER Mr. President, someone NOT swamp, and someone who is actually interested in STOPPING the suffering and death, not prolonging it to make bucks on a vaccine that most likely will NOT work. SMDH, this is a JOKE, and a BAD one,
Pregnant women deemed ‘high-risk’ patients as they scramble to rearrange birth plans due to pandemic
Hehe, the baby has their OWN plan.
Ah, yes – but, Mama needs to make other arrangements if she was going to the hospital – midwife, maybe?
Shrugging shoulders.
We’ve done it for thousands of years.
I’m guessing we can figure it out.
Hope so.
I would not want to be in a hospital right now.
Me, either – for anything let alone birth!
My grandmother had all 10 of hers at home – cleaned up – and went back to work!!!
Mine too. My mom talks about coming home from school to find a new baby in the house. That was pretty normal in those days.
Oh, my!!!
She came to America on a huge ship through Ellis Island with (3) of them – my mother said – there was no way to clean diapers or butts except in the ocean!!!
Amazing what we CAN do when we have to..
She was one tough lady, Daughn!!! She loved and trusted in God to provide!!!
Hopefully, Navy and other military branches will use Hydroxychloroquine and Zithromax on infected personnel.
They should also start using the UV-C disinfectant lights that hospitals use to kill bacteria and viruses.
UV-C lights can be used to disinfect rooms where infected sailors have been and in the air conditioning systems to prevent cross-contamination.
Airlines and Cruise ships should also use these lights.
Forgot to post the story – Nearly 3,000 sailors to leave carrier amid virus outbreak https://apnews.com/cabbd6ade631320d515b365a6cb4c971
Lights…wonder if any manufacturing being ramped up for them?
Great point about ships, airplanes, etc.
Bet they are flooded with orders. I saw the big rolling UV-C light units used to sanitize patient rooms when a family member was in the hospital.
Bob Craft, owner of the Patriots, flew the team plane to CHINA to pick up a million face masks.
Why are we still buying these thing in China?
China SHOULD be giving them away as “sorry we screwed up your lives” apology.
If we are not buying them from American manufacturers.
We DO NOT want ANYTHING from China. Those masks will either be DEFECTIVE, or contaminated. NO THANKS>
Thought this was very strange…wonder if there is an underlying purpose for the trip there?
Need to catch up on comments, but our county reversed course and HAD to follow Gov. Abbott’s GA-14 order, which is thorough but preserves our freedom of movement and religious gatherings.
The one thing that has shocked me throughout this whole ordeal is that local and county officials have been very happy to curtail our rights, even in Texas. Even in rural Texas. It is a sight to behold. Thankfully, the citizens pushed back in a major way, too.
I imagine when voting time comes around, things will change a bit. 🙂
This war just went hot. They need people off the streets and not in large groups to prevent loss from cartel or terrorist response. Make America SAFE Again!
I am with ya. Something is different.
I HOPE and PRAY that is it, it is the ONLY thing that would make the suffering we are doing WORTH it. IF it is so, and they PAY then I will forgive this, if not and we are being snowed, they do not know yet the meaning of the word “HOT”.
Well if this virus is as contagious and as prevalent as the media wants us to believe, congregating in large groups is a very bad thing to do.
Agreed! But we were already there. The place is like a ghost town, except for the Walmart. Why? Because every other small joint in town is closed down. So they have us all congregating there in order to do essential shopping.
The madness of some of these decrees is very evident.
As long as you feel safe.
I’m not paranoid, if that’s what you are asking. 😁
This thing has a 98% or more recovery rate. Not going to lose my marbles over it.
Putting people in a box is ALSO stupid, how do we get herd immunity? What if they forced healthy people in with SICK people, it would and WILL make it WORSE.
“What if they forced healthy people in with SICK people, it would and WILL make it WORSE.”
This part is already done. You have a logical contradiction in your thinking about contagion – fix it to make your theory stronger, one way or another. If you think this stuff is highly contagious, to where lots of people (say > 50%) have already had it, then the initial month of stay-at-home orders have burned it out in the micro-groups, for the most part, and now we benefit by keeping well people isolated.
If you want to achieve herd immunity with the LIVE VIRUS, then that means infecting healthy people with the virus is how you get there.
But if theories that most people have had this are WRONG – and I strongly suspect that they may be wrong – then by a strong public mixing WITHOUT isolation of at-risk people, we are millions of dead seniors away from herd immunity. This is what the TRUMP GRAPHS SHOW.
Now – this is where it gets REALLY UGLY, because I suspect that this virus reduces life-span of EVERYBODY who gets it. THAT is a population controller’s panacea.
What it means is that ALL THE PEOPLE that our other expensive medicine has saved, are at risk of being CULLED by this disease – this CHEAP CHINESE KNIFE that CULLS THE PENSIONERS.
MAO’S FLU.
If you can magically make sure that our HEALTHY YOUNGER PEOPLE GET THIS – and that it’s not deducting an average of 10 years from their lives, which I suspect it is, then the herd immunity argument washes – yeah – get ’em all out there and GET ‘EM INFECTED with NOTHINGBURGER.
But I suspect that antibody testing will only show 10% penetration max, which is bad, but good, because if I’m right that this stuff is automatically debilitating even to recoverees, then we have done the RIGHT THING by stopping it cold.
We don’t know as much about this virus as the CHINESE and THE CABAL. What if they know that corona viruses have a general life-limiting effect on humanity?
They raided our retirement funds. And now they are raiding our retirements THEMSELVES.
Truly diabolical.
Onlyy ONE thing makes me feel that the quarantines are the WRONG approach, and that is that those pushing this, Fauchi Gates, et aL WANT the quarantine to go ON AND ON. If it were GOOD, they would NOT want it. Just like they are AGAINST Chloroquine, AND antibody testing, but FOR vaccines.
JMHO
Yup – he has a self-interest which he pushes – MOST CHANCE OF MINIMUM DEATH AND DISABILITY FROM THIS VIRUS.
Note that this is not even the same as “most chance of minimal overall death and disability during the time in question”.
Also, I don’t think he’s factoring in the idea that a robust economic response is HEALING and PROTECTIVE to the sick parts. We can have more innovation if we allow the moving parts to move.
We need to move toward more SELECTIVE and FLEXIBLE quarantine.
This is a retrovirus.
Just like HIV, you can hit it hard with anti-retrovirals _WHEN_ you _FIRST_ get it or you will have a lifetime disabling condition and expensive medical care needed chronically.
Just like MUMPS, this hits the testes and can sterilize those infected. (Nut sure mumps is a retrovirus, but infertility has been raised as an issue.)
Just like XMRV, it could cripple normal immune function leading to bouts of intense fatigue, depression, brain fog, and latent rare cancers.
A carrier that encounters someone who already has a predisposition to an over active immune response may not survive the infection obtained from that carrier.
As with many viruses, it may sequester in the nerves of the spine and become an opportunistic infection when the body is weakened.
And as you have learned, it can do damage to the lung tissues that may or may not heal.
I hope this is over in 30 days.
I hope LESS, Trump needs to go BACK to his initial GUT reaction and prediction of EASTER, that is STILL 2 weeks or almost away.
General Flynn changed his banner to an Eagle fighting a Grey Wolf (not our beloved Wolfie!). If that wolf represents Bush Sr, it explains why the US is in the Carribean now. Central America has always been a clown show. Oh, and a bounty on Maduro.
https://social.quodverum.com/@kbrendell/103924798096780348
Was Bush Sr. Timberwolf?
yes
Thanks, DP!
Oh I hope and pray we can bring these bad guys down to Gehenna!
Actually, that is a coyote, as in trafficking from South America…
Power corrupts, ABSOLUTE POWER corrupts ABSOLUTELY. Not ALL politicians, even Republicans are like Trump, doing it for the good of the country. The Govs are LIKING their new found FAME and POWER, not to mention TV time. It will be HARD to “turn that off” and give up.
Time to take their TOY from them.
Personally witnessed that over and over …the addiction to new-found fame and a certain degree of power…in places and groups you would never dream…ie the Miss America Pageant, professional sports, entertainment industry, etc.
Suddenly acquired and just as suddenly gone. Many understand the temporary status but far too many expect it to last forever and cannot handle the return to obscurity. Think of all the has-been, overrated “entertainers” that still feel compelled to rant their anti-Trump nonsense…in most cases just to get their name back out in the public. As if any intelligent person cares what Bett Midler or Cher has to say about anything.
AGREED!
Remember the big post we did about the greatest financial scam in the last 30yrs?
The movie, China Hustle detailed it all.
Fascinating movie, left me wide-eyed, jaw on the floor.
Bottom line, China companies lied on their balance sheets, put forth those balance sheets to the NYSE and NASDAQ, and raised money from Americans for Chinese companies.
The hustle started in the mid 2000’s.
Total loss was between 40-250 billion AND it is still going on.
Latest scam from China is to put Chinese companies into ETF’s by a higher % of the bundle of companies within the ETF, therefore billions would flow to chinese companies from military pension plans, firefighters/teacher pension plans, etc.
Today, here I sit, watching Fox Biz in the background of the office and to my surprise I see Lutkin Coffee is down almost 75% today
Lutkin coffee is a direct competitor to Starbucks in China. Lutkin tries to replicate the Starbucks biz model only they are a little bit cheaper. Makes sense on the surface, right?
Billions poured into the company based on results and biz model, and the company built more and more stores.
But wouldn’t you know it??
The VP of Sales lied about annual sales in 2019, over-estimating by 350 million the bottom line.
With a real CPA firm, he could not have misrepresented sales so wildly.
Again, stock is down, now 69% today.
China lies.
They cannot top lying.
They cannot compete unless they cheat.
They can never be trusted again, and this time, the NYSE is helping them.
This is insane.
Hmmm
https://twitter.com/EBaker_NY/status/1245724185902661633?s=20
oh yeah…see below…
post-COVID 19…. all things considered…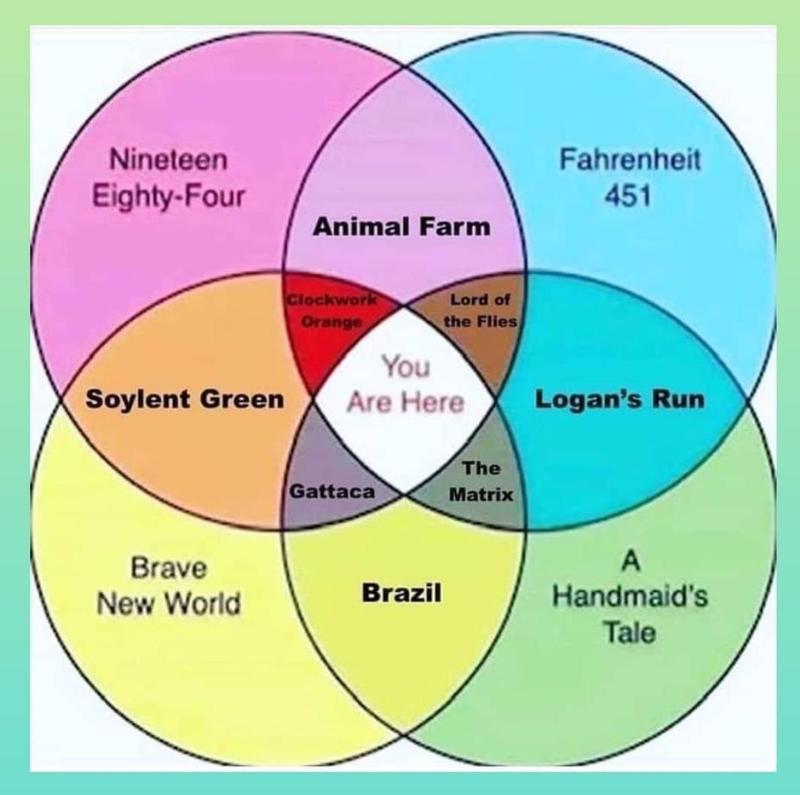
I want to LIVE just to see JUSTICE.
What fresh hell is this Demon trying to invoke. If at first you don’t succeed….🙄
(BOGUS) Impeachment Redux….
…and, BTW, what’s the definition of INSANITY again ?
It’s also the definition of DESPERATION 😉
I think will change that from doing the same thing over and expecting different results, to “just being a progressive dem politician”
Woot, moar disinfo campaign.
First of all I had to fight with Twitter that demanded I needed to log in. Deleting twitter’s cookies fixed the problem.
Looks like some anti-Trump folks are spreading this one around.
The guest, Dr. Rishi Desai, Chief Medical Officer at Osmosis, starts the interview by shaking his head no when Fox says that millions of tests are available.
Without facts to back it up, this headshaking doesn’t have any meaning other than throwing shade. The issues with the testing and capacity have been very well discussed and there is a lot of transparency about it.
Observations:
Desai picks a few interesting facts – specifically timeline items – and mixes in his opinion in the middle of it.
a fact-“China announced the Coronavirus outbreak December 31 2019”
+PLUS+
a biased opinion-“Someone should have been working on this months ago”
He presumes that no one was working on it.
At this time this was discussed – samples of the virus had to be acquired and transported to U.S. labs.
Sample acquisition presumes – PRESUMES – that China is operating in good faith, AND competently.
As I recall we found that the initial samples China sent samples and we found later that there were discrepancies with the official samples and the samples received from infected persons.
The clear implication that tests were not being worked on is bogus.
It was being worked on – In ACADEMIC TIME and in BUREAUCRAT TIME.
At a time when the outbreak appeared, according to Dr. Birx and all experts, to be a severe localized outbreak similar to SARS.
The system, as inherited, was working as designed.
From there he takes the known facts, that anyone could know from watching the daily briefings, and then doesn’t draw logical conclusions, but instead directly inserts his own narrative.
He compares the U.S. with S.K. and at 1:15 inserts his own FAKE TALKING POINTS AS IF FACT.
“because we [U.S.] had a very weak response and they [S.K.] has a really strong response”
Fox News anchor paused for a long time – obviously had not thought this through and was NOT prepared for blatant disinfo.
The U.S. did have a strong – DRAMATIC, even – response, and had it early on, and continues to be a strong response even now.
No amount of Monday morning quarterbacking by the FAKE “experts” can show that the U.S. response was anything but far ahead of the curve in anticipating the expansion of the epidemic.
He can show NO POINT where the U.S. response was inadequate.
He has NO RECOMMENDATIONS that demonstrative show how the U.S. could have gotten out in front earlier, been more agile, or better anticipated what was needed.
They are nothing but empty talk.
Meanwhile, while they talk and make the rounds with journalists peddling their own arrogant superior elitism, Trump took DECISIVE EARLY DRAMATIC and EFFECTIVE action that made a significant and measurable difference in the course of the epidemic.
A lot of the info in the recording includes known facts – but pressed into service to support the disinfo narrative.
It’s covidpeachment or flood the system with lies and defeat Trump in November.
(…and…JMO…nothing whatsoever to back up my comment…just my opinion…I am now beginning to wonder if maybe this intentional pandemic could be a test run just to see how easily it would be to collapse the world markets…and esp the USA who poses the number #1 impediment to the globalist agenda…and, therefore, what might be next if the various nefarious goals aren’t met this time.)
Look at ozzytrumpster’s post here:

https://wqth.wordpress.com/2020/04/02/4-2-20-news-roundup-war-against-the-cartels-unaccompanied-minors-arent-getting-into-our-country-guns-sales-were-through-the-roof-in-march-keep-crying-about-illegals-not-getting-a-check-h/comment-page-1/#comment-449579
The timeline provided here:
2020: Pneumonia-like Pandemic
2030: (ten years later) Pandemic Reappears
2030 just happens to be the Gates/ID 2020 deadline goal for mandatory global vaccine ID’s…what they call their Confirmation Mark …”vaccines” in the form of mandatory RFID chips…or something like that if not actually RFID…whereby no one can go anywhere or enter into anyplace if s/he has not yet been “vaccinated” with that ID CHIP….
talk ab a “trojan horse”, right ?
and now the Manipulators are seeing just how quickly a “pandemic” can bring the entire world to its knees…and how ppl will comply with whatever is forced on them in a time of a health emergency…
…unless you happen to be fortunate enough to live in a sovereign nation with a President like Donald Trump who sees thru all of that…and in a state like Florida with a Gov like DeSantis..
oh…wait…I almost forgot…it’s all their fault ! /s/
Good grief. These people and their plotting.
Smiley, I’ve thought from the beginning much of this is a test run…for both sides.
Cotton was a little quick on his complaint. Or maybe he made Mnuchin re-think the policy.
https://www.marketwatch.com/story/social-security-recipients-wont-need-to-file-tax-returns-to-get-coronavirus-stimulus-check-2020-04-01
This sounds like a FAKE STORY created by a DEMO-TRAP.
The IRS generally does not read LAW. Administrators at the top write their own guidance that is then funneled down into the organization, so that most rank and file are widely insulated from any actions Congress would like the IRS to take.
To me the setup looks like this:
* Congressional Democrat set up the trap by insisting that SS recipients do not need to file tax returns. There is widespread agreement so it goes into the legislation.
* After the bill is passed, IRS Muckety Mucks (SES most likely) swing into action to do exactly the opposite of the intended Congressional guidance. Thus they set up the trap.
* Mnuchin finds out, and in typical fashion, acts decisively and without fanfare to correct course.
* Story is pushed over to the WSJ
* WSJ dutifully weaponizes the story: “Trump Administration (Treasury Department(IRS)) reverses(corrects idiot bureaucrats) course”
* Other outlets mockingbird the FAKE NEWS.
Note in the article the Mnuchin quote does not suggest or indicate that an error or change was made – this view is editorialism.
Treasury Department reverses course on one-time payments
https://www.marketwatch.com/story/social-security-recipients-wont-need-to-file-tax-returns-to-get-coronavirus-stimulus-check-2020-04-01
IT’S A TRAP!!!
I am getting more and more wary of what I see now, Michael. This stuff does not add up in my mind.
online COVID-19 scams ..
link..
https://q13fox.com/2020/03/30/better-business-bureau-warns-of-mandatory-online-covid-19-test-text-message-scam/
watch out ! sounds a LOT like the current CENSUS SCAM going around…
BEWARE!
I’m not necessarily saying it is…but it sounds very similar to other scams.
Speaking of scams…many of us just responded to the census questionnaire. I did ours on the computer, but there was a specific ID number assigned and when I entered it, all the personal information came up immediately…location…has that location changed, number of people living in this location, etc.
Point is, I would think if it comes to remote voting there could be similar restrictions to help with massive fraud. One number assigned to a legally registered voter, easily crossed referenced to limit multiple registrations, and one vote per assigned number. Over simplified, but general idea.
If they seems to be the big liberal push right now, I cannot help but think there is a team working on a plan.
Official statements . . .
U.S. DEPARTMENT OF THE TREASURY
Social Security Recipients Will Automatically Receive Economic Impact Payments
April 1, 2020
https://home.treasury.gov/news/press-releases/sm967
Poor Tom Cotton can’t read.
Or he got punk’d.
lousy staff most likely
I think he got PUNK’D!
They did the same to Matt Gaetz back when POTUS killed Qasem Soleimani and the DemonRats were trying to pass a bill that limited President Trump’s power to respond to Iran aggression.
The bill he saw WAS NOT the bill that was actually being pushed so he voted for it. He got a LOT of flack because of that and probably lost quite a few voters.
Oh gosh, Cuomo just said they are going to do a hospital by hospital survey to see what supplies are needed. Now where did you hear that before????
This guy is incompetent. A nobody poster on a Q oriented website could figure it out in minutes but it took him days and days. Is he deliberately dragging his feet?
Dilemma for the presstitutes. Should Trump stop ALL immigration, will the media/CCP whores change their tune on the virus panic?
Normally I turn off FOX when this jerk appears, but today I kept it on and heard this live. I almost threw up.
Listen to what Fredo says and then REALLY listen to his big brother’s response. Eeeewww.
AHHH, Cuomo JUST pulled the curtain back , revealing the WIZARD. ALL the projections of doom and gloom that Fauchi…er Dr Doom and ALL the MSM and the REST who are perpetuating this FRAUD come from….wait for it…the IHME study..founded and funded by…..BILL GATES.
FRAUD CONFIRMED. Fire Dr. Doom, NOW, get the economy back, go OUT of the country for the BEST virologist in the WORLD, get him here, and follow your GUT Mr. President. This is a FARCE propagated by BILL GATES and the Cabal, NOW I see WHY Fauchi is AL IN on that study and his “my precious” vaccine, he is in BED with Gates, Mr, RFID chip and the ONE that had that stupid conference MOCKING the almost EXACT virus even we are EXPERIENCING NOW.
This IS ALL a setup. To to END it Mr. President, and while you are at it, investigate GATES’s role in this, then if he is complicit, he IS, ARREST HIM, and then we ALL can sue HIM and take his billions to repay all the damage he has done.
NO ONE here better cite those projections AGAIN. If you do, you are citing a LIE propagated by BILL FREAKIN GATES and the CABAL.
exactly …and the chicom biowarfare involvement…that Canadian lab investiagtion…remember that ? quickly scrubbed and “debunked” in a hurry…
We have the WIZARD, we have the TRAIL, we WILL or already have enough evidence, I bet the antibody study IS THE SMOKING GUN, and that is why Fauchi quickly pissed on it. Time to END this and round them ALL up.
Patience Grasshopper…….. Patience.
Trump’s got this. 🙂
I hate to say it, but he better make it QUICK, my reserves $$ is running LOW. I and Mrs Rex will NOT be getting a check. We made too much, but now we are down to 25% of what we made(conveniently NOT factored by the politicians). I am losing the business I just started, I have MAYBE 2-3 weeks and then I am TOAST. The unemployment for my employees in this state is a DISASTER, and they don’t know WHEN or IF they will get it. I can’t keep paying them.
Then there is the SBA loan farce, being again run by the state, it is a cluster. RENT goes on, UTILITIES go on, INSURANCE goes on. SUPPLIES go bad, or ineffective. CLIENTS go ELSEWHERE.
There is MUCH more to this my friends, I KNOW. Many are suffering, and will soon REALLY be suffering. This HAS to end and SOON, or more people like me will be SOL. This idf taken too long will NOT alow businesses like mine to restart on a dime, it takes TIME to get capital back. That is why this FRAUD by Dr DOOM and Gates MUST end, end SOON.
I understand….. and Prayers up for you and yours.
TY, I try to avoid getting REAL here, but I look at you and others as friends, not just fellow posters. What I am experiencing is REAL and widespread. People need to KNOW, not for just ME, but for the THOUSANDS like me.
People just think it is EASY to stop work and businesses, and that the GOvt can just snap fix it. As with LIFE, it is ALWAYS more complicated, there are ALWAYS conditions, and exemptions. NO ONE focuses on those.
Thanks again! Stay SAFE, I PRAY the fraud is over soon for us ALL!
I for one……. am ALWAYS “Real”.
I consider YOU and some others here as….. FRIENDS. May GOD Bless each of us here.
You too!
Thanx Friend 🙂
Cant do emojis from this pc, but Thumbs UP!
Only emoji’s I know are happy and sad faces
P-Rex fixed costs are a BIOTCH!
We have 21 equines and 300 plus goats and sheep, who are in the middle of multiplying, to feed (not to mention mortgage, electric, insurance….) IF I do not get my business running again soon I am not going to have the $$$ to pay for hay this winter. As ‘entertainment’ when the economy slumps we are the first to be hit.
Unfortunately our ‘season’ is March, April, May …too hot…. September, October, November… too cold….
That mean we could lose close to 1/2 this years gross income.
From the cabal perspective, it’s a set up. From the anon perspective, it’s cover for the REAL operation. We had clues on it at the presidential press briefing that only FOX and OANN carried yesterday. They’re going after the trafficking cartels. PUBLICLY.
Game theory.
Game OVER when going against the US.
Yeah, but it is TIME to SETTLE all US business, and END this farce, round them ALL up… GITMO for ALL, just until the gallows are built that is.
It’s not going to happen in the next 24 hours.
Jesus, Mary and Joseph.
Let it play out. The people are being sheltered. They are going to be 9-11ed in emotional shock when it all comes out.
I know, but the economy is DISENTERGRATING before our eyes. it is like a freight train, easy to KEEP going and speed up or slow down. HARD to stop, but INCREDABLY hard to START back up again, the longer we wait, the MORE damage, and the HARDER to restart. The Cabal is STALLING for time. They have stalled ENOUGH. It is GO time .
I don’t think it’s going to be as hard to start up as other people think it will be. All these upper middle class people just aren’t used to cooking and will be dying to go out. Most of us need our hair tended to. We’ll be at the end of tornado season here in Tornado Alley which is when a lot of people buy cars….
I PRAY you are right.
“….. cite those projections???….”
What the projections modeled on the ClimAstrologist Computers with the same A-hoes doing the programming?
Gore Bull-Shiff Warming burnt me out on computer models years ago!
translation : a river, a bridge, a clock chimes
..and now…the mysterious case of the missing WUHAN whistleblower < Dr Ai Fen, who has "gone missing"…I posted an article ab this on a recent thread here…can't find much of anything else ab her except this article from yesterday…
link…
https://www.zerohedge.com/health/disappeared-wuhan-whistleblower-doc-suddenly-sends-cryptic-message?utm_campaign=&utm_content=ZeroHedge%3A+The+Durden+Dispatch&utm_medium=email&utm_source=zh_newsletter
April 1, 2020
she…or someone…is starting post cryptic messages…like the one above…
The wench who was interviewed here blamed PT and Chi.
My apologies for duplicate if this was already posted but it seems important.
“Why is New Orleans’ coronavirus death rate 7 times New York’s? Obesity is a factor…
“April 2 (Reuters) – The coronavirus has been a far deadlier threat in New Orleans than the rest of the United States, with a per-capita death rate much higher than in New York City. Doctors, public health officials and available data say the Big Easy’s high levels of obesity and related ailments may be part of the problem.
“We’re just sicker,” said Rebekah Gee, who until January was the Health Secretary for Louisiana and now heads up Louisiana State University’s healthcare services division. “We already had tremendous healthcare disparities before this pandemic – one can only imagine they are being amplified now.”
….
https://news.trust.org/item/20200402092110-6rvk1
Louisiana had a big jump in cases today -2,726.
It seems as though the WuFlu started in or around Washington State in the winter when people naturally wear more clothes. I think NY may have been next with New Years Eve, again people wear more clothes because of the cold. By the time it got to Louisiana the weather was warmer, less clothes and a longer duration of time when people would have been exposed.
In Washington State, it seems to me, people were wearing large water jugs on their heads and/or wrapped in plastic bags. Less exposure.
The only other answer would be that the virus is getting stronger?
Linda, sounds possible, and pray to God it isn’t mutating thusly.
DON’T FORGET….
– Louisiana held Mardi Gras as usual despite the virus.
– A special Carnival Mardi Gras cruise ship with thousands of passengers came to Mardi Gras….
Didn’t know about the Carnival cruise ship. Interesting.
….Italy also had an infected cruise ship with thousands of passengers disembark and help spread the virus.
Open Borders Europe is learning a valuable lesson.
ANND Rush just echoed what I have been saying here for WEEKS. He thinks CA is NOT as bad as NY because they ALL had it earlier, thought it was something ELSE, and got herd immunity. JUST as I have been saying. We ALL got it way earlier, most chalked it up to something ELSE. Now, you KNOW why Fauchi is resisting the antibody tests, they put the LIE to the FRAUD.
The MILITARY needs to run some antibody testing on communities. If this is biowarfare, which it potentially is now, thanks to Rich Higgins’ group spotting this as TEXTBOOK CHICOM COLONEL ASYMMETRIC SHIT, then our wonderful military needs answers that THEY can trust.
I would trust the military to take over one of these somewhat clown-stinky bio company operations (meaning MILITARY people come into the labs and watch ALL results and ALL calculations) and then get data on entire communities.
We can have that data NEXT WEEK. And the data answers the question.
I personally think the answer is NOT that we all got it, or we would be seeing a LOT more death and disability IN THIS GROUP.
I will be blunt. I can NAME THE PEOPLE IN THIS GROUP WHO SHOULD BE DEAD. I was one of the healthiest people in this group. Now I’m in view of that meme of the guy in a Walmart scooter with an American flag, a MAGA hat, and an oxygen tank.
But we can prove the truth NOW, so WHY NOT??? What is the real “pre-penetration” of the virus? And if they’re not testing people like me, which they are NOT, then maybe they don’t want the real answer.
But the military needs the real answer. If some soldier knocks on my door and wants blood, he’s getting it.
WAIT, what if the USNS Comfort and MERCY are CONVENIENTLY there for Covid 19 testing (antibodies) They are NOT working on Covid 19 cases now, they are for the REGULAR ER patients to “relieve” the stress. CA and NY, TWO hotspots, one ACTIVE (NY) the other DECLINING (CA).
COMPLETE military control and TRUST of the results. What say you?
That sounds like a PLAN I would TRUST.
If they’re not getting a blood sample from everybody coming in, they’re not 20 steps ahead of us, and we know they ARE 20 steps ahead, minimum.
AGREED. Look how QUICKLY they turned around the NY ship. COVER by relieving the OVERFLOW, and NOT the actual Covid cases. Brilliant if true, and SECRET, but TRUE info Trump could TRUST. Info that would REINFORCE his original GUT reaction and DISCOUNT Fauchi once and for all.
Trump has SMARTLY put the “noose” of this FIRMLY around Fauchi’s neck. He and his projections, will be LAID BARE.
Wolfie,
The US military has their OWN scientists, I know because I dated a couple of them. 😳
The Army for example has not only medical doctors but lots of veterinarians too. There is ZERO reason that the US military can not run their OWN tests period.
If you listen to George Webb, his contention is that patient zero for the USA is a military person who was at the world military games in Wuhan in October. It might be THAT SIMPLE.
That may indeed be true. And on top of that, I will guarantee that it was a CHINA VIRUS – exactly what POTUS says. But it is based on Sylvia’s sister picking it up from travel to Morocco that I’m thinking it’s likely it was spread to multiple attendees selected by the ChiComs.
Damn, Rush.. HAD to have read my blog..LOL He is echoing my EXACT hypothesis that I have been debating with Steve and others here. Hey Steve, I am NOT Rush Ok. LOL. I do NOT even know him…yet…(winks) I sure hope Rush share this opinion with TRUMP!
The cabal must be running out of money.
UN Wants a 10% Global Tax to Pay for New “Shared Responsibility” Program to Address Coronavirus Pandemic
https://www.thegatewaypundit.com/2020/04/un-wants-10-global-tax-pay-new-global-shared-responsibility-program-address-coronavirus-pandemic/
FUCK YOU, CHINA!
Can we set a time/date to shout that around the world. I want the UN OUT of the USA. YESTERDAY!!!!
Yup. Just like the WHO is China’s puppet, the UN is, too. GET ‘EM OUT.
U.N. gets $0.
Blatant power grab.
They were HOPING to get the $$$ from the USA via the Paris Accord. POTUS torpedoed that and a lot of other money schemes and they are now really hurting for $$$$.
They really ARE Parasites sucking our blood/$$$ and POTUS has been detaching the sucker arms one by one.
They are trying to do an $8.7T MONEY GRAB and POWER GRAB.
What could the U.N. do with $8.7T???
“The establishment has trillions of dollars at stake in this election.” – DJT Oct 13, 2016
*https://wqth.wordpress.com/2020/02/07/october-13-2016-trumps-most-important-speech/
HCQ most effective against COVID-19 by Doctors.
I need some of this shit. I’m not sure I’ve gotten this virus out of my system.
I concur, Wolfie. You need to at least try.
Wolfie you need to get the test…. NOW!
NOT smart….
https://twitter.com/Breaking911/status/1245773038894952452
This is how desperate they are. People have to step up on blood donations, or they are FORCED to do this!!!
Does Covid cause some type of unusual bleeding? Anemia? Why the sudden uptick in the need for blood donations?
People aren’t donating. They’re staying away from going out, from coming into blood centers, etc.
It wasn’t a sharp decline of the banks – it was non-replenishment.
And then you know what the fucking cabal did? They pushed the misinterpretation of the Surgeon General’s words “Donate Blood” to be “Don’t Eat Blood!”
Cabal reverso is so smart, most people are total suckers for it. The caballies SELF-HOAX to make people stupid through EXCESS. It’s pretty ingenious. It’s exactly how the pedos PROTECTED THEMSELVES with Pizzagate.
The official reason is that there are no blood drives going on right now due to the shutdown.
China reopens wet markets.
All we have to do is shut down the China-BAT connection. SEAL OFF THE CAVES. DESTROY THE RESEARCH. SEND THE FUCKING U.N. IN TO BLOCK OFF THE CAVES.
They can eat as many fucking pangolins as they want. NO MORE BATS. But the wet markets are not the actual problem – they are COVER for the real problem. CHINESE BIOWARFARE RESEARCH.
Here is what PRESIDENT WOLF MOON would do.
NUCLEAR PARATROOPERS sent to every fucking bat cave in China. Orders to MINE THE CAVES and DESTROY THEM if the Chinese even come close. Small nuclear mines, laden with cobalt-60 precursors, to keep the entire area radioactive for centuries.
Don’t even talk about the WUHAN SITE. OBLITERATED. BOTH OF THEM.
I endorse “Rods from God” on all of their BSL sites. They have proven that they cannot be trusted to act responsibly. Next, collapse their economy and let their people eat their leadership. Full on embargo, hack their defense systems and render them useless. Can you tell that I’m not a fan of China yet?
I mean, listen to fucking useful idiot (remember ISIS?) Lindsey Graham FALLING FOR BAT SOUP.
It ain’t bat soup, people! This is CLASSIC CHI-COM DISTRACTO.
They “threaten” with BAT SOUP and look who comes running!!!
WAKE UP YOU FUCKERS. They cover for BIOWARFARE by YANKING YOUR CHAIN with BAT SOUP.
If you can’t play chess with CHINAZIS, play checkers with Pelosi on infrastructure.
Sorry, Wolfie, China is ‘hollow’ it is so full of limestone.
Yes we need a strategic weapon selection to match the geological, biological, and threat landscape to achieve decisive action on target resulting in total threat elimination.
We should look at napalm.
This may have been posted, found it very interesting…
Good. STAGE TWO – LAB ACCIDENT.
The truth will be EVEN MORE SINISTER, but will be THROUGH THOSE RESEARCHERS who were used as firewalls of “it was just an accident”.
STAGED ACCIDENT.
Everybody wants in on the $$ bonanza CV19 is providing~~ ( $$ and control)
One of the Doc pundits last night recommended TWO EKGs, one as a baseline and another one at about 3 days.
“need to be monitored closely”
What?
You suppose they give EKGs to all those in Nigeria where they pass out chloroquine like candy?
Apparently one of the side affects, especially at higher doses, is that HCQ can cause electrical malfunction of the heart (AFIB?) and result in a heart attack. The EKG shows AFIB waves so it would make sense that they would need a baseline to establish risk and a follow up to ensure tolerance. Unfortunately for the poor in 3rd world countries rife with malaria the benefit outweighs the risk.
Their average life expectancy in Africa is around 52 to 68. Heart is not going to be that much of a problem.
https://www.worldlifeexpectancy.com/life-expectancy-africa
If I was going to have to be hospitalized at any point because of WuFlu, I would take the risk of heart attack vs, the risk of not getting HCQ. Forget about intubation also. DH and I just had the discussion.
Hospital downstate is overflowing now. Large metro in flyover country. DiL doc…masks are being sanitized because of huge shortage. I sure hope they are being disinfected.
PRESS BRIEFING SOON!
WH – https://www.youtube.com/watch?v=WcMJutiXTak
Do you think Chanel Rion will be there?
Yes. Rightfully so.
Stephanie invited her back, she will be there.
Saw last night that OAN lost it’s seat. However this:
https://www.citizenfreepress.com/breaking/chanel-rion-speaks-out/
Chanel is there tonight at the invitation of the Press Secretary and asked a question.
Good. Thank you. I was surprised and happy to see someone from EWTN ask a question the other day. Like hooray!
POTUS just said he signed the Defense Production Act against 3MM to get them to produce face masks. They must have been holding out here. I know China stopped them over there from sending masks here. Imagine, they Nationalized an American Company.🙄 Navarro said 13 out of 20 of our supposed Allies had blocked exports to us. I’ll bet some of those included 3MM factories as well.
POTUS- We don’t need another Witchhunt during a pandemic. A waste of resources. All they do is drive up my poll numbers.
72,000 watching White House
52,000 watching Time
24,000 watching Fox 10
17,000 USA Today
12,000 watching RSBN
7,000 watching GST
? CSPAN
No telling how many watching on CNN, CBS, ABC, foreign news orgs.
This is the 1st day local NBC, CBS, ABC is NOT showing briefing, instead airing local news. Local Fox is. Really is a shame, small businesses need the info – Houston and surrounding area has population of 7 million+
FAKE FAKE FAKE.
Disgusting
In Detroit I started watching (all broadcast) on FOX & when they left went to ABC & when they left clicked by NBC & CBS & both were giving wrap up statements as they were then shifting to local programming. FOX was the shortest to watch. The others left as the VP came to the podium so we only got the SBA gal & Treasury Sec after POTUS. Oh they may have stopped the broadcast ’cause Trump was leaving for a meeting & then was coming back later with further info & to take more Q’s…hmmm
POTUS took the 15minute virus test, much more pleasant. 😁 Passed with flying colors!!!👏👏👏
https://twitter.com/niro60487270/status/1245833740527349760?s=20
Jared stepped up to help manage supply chain issues. Just sent 1months worth of supplies to NY, primarily N95masks. They’ve been getting requests from people based on projections NOT immediate needs. He’s working with all to get them what they need now.
Obvious that the Governor and Mayor cannot run the state.
I think Cuomo could if he wanted to. He’s under orders to piss and moan instead.
No. He can only rule like a tyrant. He cannot lead.
Every statement and decision that he makes has a political agenda.
You prove my point.
I agree with Daughn:
“… the Governor and Mayor cannot run the state.”
Hope that clears it up for you.
Rear Admiral John Polowczyk, Joint Chiefs Vice Director for Logistics (FEMA) – Project Airbridge to get supplies from overseas faster – normally takes 37 days – They’re already received 6 planes, 28 scheduled. TRUMP TIME!!!
Engaging distributors to expedite. Getting supplies delivered to counties, working on direct to hospitals.
37 days is the time it takes me to get an order from effing CHINA!!!!!!!!!!!
are they ordering from China?
Yep. Been seeing that. Scary, don’t trust a thing from them.
200,000 masks to NY shipped today
They’ve been collecting data for 2 weeks, know where abnormalities are, now know what everyone needs.
I’m in love with the Vice Admiral of Logistics.
He’s great. Logistics is an art form of sorts. You work enough outdoor events, and it takes a team to get everything to where it needs to go. This guy is doing it on the fly.
He just said he’s putting volume into the system that serves both public and private heathcare systems. Beyond that, it’s on the states.
He also just said there’s been some abnormal behavior.
Yeah, it would be up to the states Operations Chiefs to deploy the resources. Recently began my FEMA NIMS/ICS training.
He’s not so good at fending off the jackals.
Tells me that he’s a primarily data guy that knows how to make the supply chains work.
IOW he’s our man 😉
Telling off the the media is skill that Navarro is better at doing.
Navarro has a lifetime of experience being a contrarian that can think on his feet.
200K N95 goes to public hospitals.
loading on pallets now.
I sounded like it was going into the supply chain and all healthcare systems can access it both public and private.
The White House has some superior talent running this response.
Stupid reporters don’t understand why everything is not free
“Why do they have to pay for it?”, is basically what she asked.
Oh they’re just pretending not to know.
It’s very simple:
AMERICA WILL NEVER BE A SOCIALIST COUNTRY.
The Press keeps trying to PRIME the PUBLIC’S EXPECTATIONS that everything will be magically free.
(Sadly many people buy into this claptrap during a time of crisis.)
Another Defense production act signed today to get the supplies needed for the companies to produce the ventilators.
Nothing yet on Hydroxychloroquine
Are we just supposed to die?
Here comes the assassin, Peter Navarro.
Jared Kushner is working with him.
Shaking those trees.
If we HAD the drugs we would not NEED the ventilators.
Once they go on a ventilator, the chances are not so good……
Navarro: black market springing up, and domestic stores are being exported. Customs and Border being empowered to crack down on the hoarders selling inventory overseas.
HA!
Companies chipping in, making production of masks, being purchased by brokers……… price was bid up and up and up……….. then being EXPORTED.
OMG
Peter Navarro, cracking down hard, will deal with them unmercifully.
President signed another order today.
Navarro talking about solving two problems for the NYPD in RECORD time
Well done.
That’s what 3M was doing!!!!!!
Navarro: WE ARE DANGEROUSLY DEPENDENT ON A GLOBAL SUPPLY CHAIN.
YEA! Somebody said it in plain English.
NYC police currently have over 10,000 infected officers. POTUS and Navarro got them 4,000 Tyveck suits and gloves sent in 16hrs. Also got barrels of hand sanitizer shipped.
That was Defense industry pitching in – I think he called General Dynamics and Raytheon
Stand up and CHEEEEEEEEEEEEEEERRRRRRRRRRR
Peter Navarro is kicking ass
Talking about the dependence on the supply chain, dependence on other countries.
Buy American
Secure borders
strong manufacturing base.
Need it now.
Going forward, the VA, DOD, and Medicare will buy ALL AMERICAN when this is over.
We don’t want to disrupt anything now, (I get that) too difficult.
🦋🦋🦋🦋🦋🤸♀️🤸♀️🤸♀️🤸♀️🦋🦋🦋🦋🦋
Can’t campaign for America First any better than this press conference.
Ventilator Capacity needs to be set up so that it can be scaled. One of the stories I heard was an innovation that allowed eight users can use a single ventilator. That’s the kind of scalability that will help provide the capacity for this kind of situation in the future.
“Are you going to reopen the Obamacare Marketplace for people who need health insurance?”
TRAP TRAP TRAP
“We’re doing better than that . . . we’re giving those people direct cash payments”
BOOM!!!
That does NOT need to happen. Money needs to go to the hospital.
We would save a fortune.
Yeah no kidding! Such a dishonest fear generating question. Insurance is less critical than money. Same idiot reporters that wanted all supplies for free! They want free supplies and govt insurance at the same time!!!
Trump cannot sign an EO and reimburse every American who sought medical treatment for COVID.
He needs Congress.
Asked and answered YESTERDAY
Quit asking the same damn question.
Saudi and Russia fighting over Oil Prices.
Media claiming what Trump said is not what Saudi is saying.
Trump said, well, that’s what he told me.
Saudi has called OPEC for an emergency meeting.
Can the deal fall through………. of course it can.
Can someone get ticked off and walk out…….. of course they can.
Trump alludes to another idea… which he HOPES HE DOES NOT HAVE TO DO.
Hmmmmm
I don’t know what it would be. I am speculating either import quotas and/or oil tariffs. That can be done unilaterally.
Media is snarky today.
Today????????
They really are insufferable. Every day.
Pence and Task Force considering direct payments to the hospitals for payments of COVID treatment.
Makes sense.
If sent to the people, it might not ever get to the hospital.
and pricing would be different for every person.
This way the gov’t negotiates.
Cash payments to the hospitals to compensate for treating uninsured individuals is a much smarter way to deal with the issue than opening Obamacare. Plus it checkmates the lib reporters who want to bitch about healthcare
They are desperate to ressurrect the dying corpse of Obamacare. Never let a crisis go to waste.
and they got trumped…haha.
Media pushing the idea of everyone wearing a mask.
We will all be Q T Fa.
LOL !
Nor’easter 💖💖💖🤓
You staying healthy??
Yes ma’am !
How ’bout you ?
Yup 🤓 😀
😉
It is COMING, but NOT for the reasons they THINK (BACK to work) Coincidence…NO FAUCHI…. Happy accident, or did Trump LISTEN to me, US and others and get him out?
Fauci is talking now.
Ah, he saved Dr Doom for last, he did not disappoint, he said, and if THIS does not reveal this farce to the WORLD I do not know what to tell you, ” we will relax the social distancing guidelines when there are NO new infections or deaths.”
OK, see you all in 2025, when mad max, the Terminator, and Waterworld are the post apocalyptic world. By that time the US will BE Venezuela, or WORSE.
Sigh, I guess if Trump is not going to wake up, he better get prepared for the SOON coming civil discord, and I give it 3 weeks MAX.
People will say F this shit, when it is 80 degrees, and the projections are STILL nowhere NEAR the REAL numbers.
Anyone here want to tell me HOW we with our modern medicine, infrastructure, the cure and supplies in overdrive, we will have 10X more deaths than Italy, China, and Iran? ANYONE?
No, even IF China and Iran are lying, is Italy too? Spain? France? the UK? NO.
Dr Doom took the ABSOLUTE worst case scenario DOUBLED IT, and spouted it. Now he is DESPERATELY trying to DEFEND it.
Brix even ADMITTED, to the shegrin of the MSM and Cabal I am sure, that they are ADJUSTING the models DAILY based on REAL data. What she OMITTED, conveniently, is that they are adjusting it DOWN. WAY down.
There were supposed to be OVER 50000 hospitalizations in NY YESTERDAY according to this model. Actually there were 18000, BAD but 64% LESS.
Then couple that with the fact that Dr Doom is projecting NY, LA, CA, numbers to the REST of the country. You start to SEE the problem.
ONE question. What happens in 2 weeks when the numbers are STILL 64% LESS than the model? 3 week? April 30th?
When do we jettison these FOOLS. Actually Aubergine’s axiom, they are NOT fools, they are FRAUDS.
The country has at MAX 3 weeks before the economy REALLY crashes and the fd up states that CAN’T get the monies or the unemployment out correctly, THEN there WILL be civil discord. ANY LONGER and we WILL have Civil War 2.0.
That is MY projection, and I hope like HELL I am wrong. But people are buying MORE guns and ammo than toilet paper and hand sanitizer. There is a REASON for that.
Wake the F up Mr President, I feel SORRY for NY, but the REST of the country is MORE than that, we are NOT them.
The frauds will be EXPOSED when they have served their purpose.
I think VSGPOTUSDJT knows EXACTLY what they are and is giving them the room to hang themselves. Trust in them and the organizations they represent MUST be destroyed. That is part of the operation, and it is not complete.
Trump is making Fauci choose to do the right thing. But when this goes past, and the truth comes out, Fauci will be a bigger household name than OJ Simpson.
He will live in INFAMY. Dr DOOM. maybe even Dr DEATH. Trump has SMARTLY, put this SQUARELY on Dr Doom’s sholders, he is too self absorbed and STUPID to see that he is the one whose head will LITERALLY be in the noose with the AMERICAN PEOPLE when his doom and gloom projections do NOT come true, and they will balme HIM for all the losses of money, lives, and SUFFERING.
He for SURE will NOT be able to walk the streets. If this farce continues much longer, his own security detail may shoot him, no BS.
Local news and politicians here are pushing masks as well.
Birx is way too focused on modeling and not focused enough about solving the problems.
She’s an academic and not a field physician.
Still no discussion of Hydroxychloroquine
The drugs aren’t on today’s agenda. The BIG topic, and I can verify this from my other social media feeds, is how to get the relief money. The next issue was to neutralize the “we can’t get supplies” messaging from governors and various other places.
The drugs are in ramp up stage, and in the place where only the most sick are getting them. We’ll probably hear about a black market regarding this in the next few days. Chloroquine is going to be a hot item just like masks, gloves and all the rest are currently.
F&F, the hosts and Dr. Oz were saying this morning that Cuomo won’t allow using HCQ in NY outside of the trials. Anyone else heard that???
A bit of history:
Before NYS legalized the medical use of canabis, NYS had a little know law that allowed the medical use of canabis under a supervised program of research. It existed for a long time until medical use was legalized. IRR back to the ’70’s, Yearly reports to the legislature were required. If you were part of the trial, you had access to it legally.
MCM doesn’t care about ending the crisis.
Birx and Fauci wedded to bureaucracy. Established processes over the decades. Too DAMN COMFORTABLE. ZERO URGENCY.
Hoping Chanel asks about HCQ, no one else will. How is the use of HCQ going in NY and other places? What is the immediate availability? Production volume today, 24/7, international availability…? When can we expect HCQ moar available to positive folks? Available as a preventive?
Guessing President Trump will bring HCQ up tomorrow, as I think it is sx days into NY drill using HCQ.
Yea, impatient here as all indications are HCQ a solution begging to be applied broadly.
Yes, I’d like them to add an actual practicing physician with close ties to a China Virus hospital to the Team. NOW!!
I’m just wondering….
What locales actually still have public hospitals? We don’t here. They all disappeared in the Clinton years, IIRC.
Guessing, public hospitals exist in D-Rat string holds.
This IS a D-Rat stronghold.
OK. Either your location is the exception, or as happens too often, I am out to lunch. FWIW, previous response prefaced with, “guessing”. My bad, a guess, not factually supported.
Well, when Hillary care looked to be our future, all the private hospitals lined up in two groups: the Catholic ones, and everyone else. The public ones kind of died off.
Socialized medicine talk stops new hospital construction fast.
She’s trying to forecast each county, expanding her modeling exponentially.
Worried about where to move the ventilators.
Still no focus on getting people OFF OF the ventilators.
Plasma replacement
Gilead and Remdesivir, etc.
So frustrating for this simpleton. Guessing President Trump is waiting moar results from HCQ, plasma, Remdesiver being used in the back ground.
Earlier, I forgot to make a note.
Infuriating.
The hospital built at the Javis Center in NYC was supposed to be for non-COVID patients.
Hospitals in NYC were supposed to handle the COVID patients.
Well.
NY cannot handle it
Pushed the President and President agreed.
Now, the NYC hospitals will send COVID patients to the Javis Center for Military personnel to handle the problems.
Cuomo and DeBlasio just pushed the burden onto the federal government and NOT their state.
It’s a BIG DAMN DEAL.
Yes it is a trap. If he said no he’s heartless like W in Katrina. If he says yes taxpayers foot the bill and military are at risk. But it’s a 4GW so we do the latter, and Nancy and Schiff are stuck at another gate.
Footing the bill isn’t the issue. It’s going to be the nightmare scenario of lack of cleanliness, care, etc. Have you seen the Javits set up? It is NOT designed for contagious care ! Many COVID patients have diarhhea. That alone is going to be a huge issue in that setting 🤬
These people are a real trap that’s for sure.
Just read Army is setting up another big ‘hospital’ in Seattle for NON-covids. I bet you anything Inslee begs Trump to put the covids there!!
And the homeless population in 3 … 2 … 1 …
Oooosh, I cannot like that one, Michael!
I originally was impressed with Dr. Birx, but we are passed the modeling stage and into triage and treatment. We need real practicing doctors up on the podium now.
Media now trying to run a claim that the immediate 5-15 minute Abbott lab test is producing 1/3 false negatives.
How do they know???
MCM ignorant imagination…to create doubt.
But FAKE NEWS puts out 2 false stories for every 2 they publish.
Pres Trump sent an amazing response to Sen Schumer. Vicious. POTUS fights back hard.
And memorialized.
And just like that, FNC thinks Martha is more important than the briefing….🙄🙄🙄
That’s because it’s a townhall brought to you by FACEBOOK. Her intro about bringing you information from the ‘experts’ is ridiculous when they discontinue the press conference where we can hear directly from the experts.
Japan just announced a ban on American citizens.
They’re also going through another flare up.
Trump thinks it is okay……. hints that he is thinking about other bans.
Talking about the plane from Russia
Did Trump ask for the help
or was it offered?
Trump, I could have said no, I don’t want it or I could have said thank you. I took it and said thank you.
I think he dodged another trap. “You didn’t accept the Russian aid?!? Peach!!!”
Media pushing Trump to ease sanctions on Iran…..
But it hurts the people
“Realistically, how is the leader of Iran going to pick up the phone and call you”
WTF?
If they are so badly hit, then their leaders should make some effing concessions………!!!!!!!!!!!!!!!!!!!!!!!!!!!
She is arguing with the President.
She’s pro-Iran.
WTF?
But but but———- Do you have a moral responsibility?
The United Nations says they need help.
Then let the UN help them!!
UN now calling for a global $8 TRILLION Covid fund that they administer. BWAHAHAHA!
AHEM.
Idiot doesn’t realize U.S. has a diplomatic channel to Iran through Switzerland.
OMG, there is Chanel from OANN, they’re still making her stand up.
Yesterday or day before she was standing also. Presstitutes have been shitty to her since Chanel called them out a couple times last week.
Both days she’s been standing in the back at the invitation of Stephanie G. They’re pissed because she’s not following the seating rules (no chair means she shouldn’t be there, so they used that as excuse to ban her) AND because POTUS likes her and OANN AND because OANN isn’t Fake News and following the herd narrative.
Jared is very specific.
Theyre making requests (governors are) based on these models, not exactly what is happening now.
Jared, asking them to go to their local outpatient and convert.
He got a call yesterday from one Mayor who requested 250 ventilators.
Jared said, but you don’t have a case in 4 counties surrounding you.
Mayor said, well yeah, but we are nervous.
Kushner is one very smart guy.
and just like that Jared said fuck you to the reporter in a professional way.
AND called out Governors and Mayors that are terrible managers.
So you’re nervous and want to hoard ventilators?
Request denied!!!!!!!!!!
So many Governors and Mayors…
– FAILING real time Management 101.
Cuomo is a hoarder!!!!!!!
N95 masks were not really used in the hospitals, mostly used in the construction industry.
Talking about Governors mayors going to the media and screaming about the feds not giving them what they want.
When one governor is asking, I encourage you to ask them about the supplies within their own state……. because they exist.
Media trying to drive a wedge between Jared and Pence, no there is no division, Jared works at the direction of Pence. If someone is saying that, they are not informed.
Whoa, Jared, when you elect someone as a governor, senator, mayor, you need to elect someone who is a good managerr in a time of crisis.
When some call me and ask for materials, they don’t even know what they have in their state yet.
Know your inventory before you even bother to call.
Yeah, my sister got her N95 masks at Home Depot or Lowe’s. She’s had sinus surgery and allergy shot therapy, etc., so she has them for cleaning dusty areas.
We were talking about N95 masks for everyone – including health workers during the Ebola scare.
Went to Aldi. It looks more like a grocery store. Limits on things but better stocked. Still no TP.
People put towels over the cart handles. More gloves being worn (and then they look at their phone). A few more masks.
Crazy times.
Thanks Kea. I gotta go tomorrow. Usually keep my list on phone, gonna write it out on paper now.
No problem. 🙂 Stay safe.
Okay, these daily briefings are about two things: trouble shooting misinformation out there, and pacifying the MSM who are no longer playing along.
This is textbook crisis public relations.
You’re not going to get the same thing every day, and there is so much information that needs to be communicated that the cast is going to change from day to day.
Expect that.
Also, Dr. Birx is not a logistics person. Don’t expect her to address those issues. That’s why the admiral was brought in. The poor woman is doing the best she can with what she has.
Fauci – please note the SPELLING IN ITALIAN – is being exposed for what he is.
The biggest issue, though, is the MSM ignoring the non-COVID-19 info that’s being presented at the beginning of the sessions. That, IMO, is dereliction of duty.
The biggest issue, though, is the MSM ignoring the non-COVID-19 info that’s being presented at the beginning of the sessions. That, IMO, is dereliction of duty.
^^^ MSM lap dogs direct support to D-Rats, COC… Destroy President Trump. R E S I S T. Unless I missed something.
We’re down in the minutiae of the models now.
Credit to some states where there peak has flat-lined.
Problems with social distancing in some areas——— dense states, locales, like NYC.
Birx just said, “I KNOW WE DON’T HAVE A THERAPEUTIC”
WTF????
There’s several, she and Fauci just don’t sanction any of them.
Maybe POTUS is purposefully not hyping HCQ to get supplied and avoid major hoarding and black market sales?
Birx..who knows?
Birx is strangely inept.
Which makes it very hard to accept some other things she’s saying even if it seems correct.
THAT REALLY UPSET ME. WE ABSOLUTELY DO HAVE A PROVEN THERAPEUTIC DUO – Hydroxychloroquine and Zithromax..
It’s working WHEREVER it is used!!!
It’s just not a sexy vaccine or antiviral with a big price tag and a patent.
I’M ANGRY about them ignoring the efficacy of HCQ and ZPacks.
As my son told me tonight everyone is looking at he lates and newest when the old reliable will do the job.
He said old doctors in the field know that and know what works.
Ha ha he bought curb side from Joan Fabrics 6 years of marital to sow some masks. He said hospitals are short and those who need them have non.
Birx going on and on about social distancing, claims she is paranoid now about touching anything.
She’s in the bubble for sure.
Well, when the models she is following turn out to be crap like most models she will be the one having to explain why they were so wrong.
She may be burning out from all the activity. She’s been on a grueling schedule without a break.
Earlier the President commented on the Navy Captain who blew the whistle on the USS Roosevelt.
Apparently, he is being removed for lack of confidence.
Huh?
Well, President said the Sec of the Navy is having a presser about it but the President said “I don’t like that at all”
He went outside chain of command, didn’t even notify his commander. Used unsecure email to contact media, created panic for family members by saying 50 could die, and raised concerns about operational security and capability that could have emboldened enemies. Demonstrated poor judgement in middle of crisis. 100 sailors have tested positive and have mild symptoms.
Well, that’s not cool. Can’t do that one.
He panicked! Not who you want as a commander….of any military operation.
no, he did not panic.
he was promised something by dims seeking to create a crisis they could attack Trump with.
NO ONE rises to command a US Aircraft Carrier with the lack of judgment this Capt. demonstrated.
he did not panic. he did not have a lapse of judgment. Naval command was well aware of his situation and was already taking swift and bold action to help him.
This was an attempt to politicize a serious condition on board a capital warship.
I sincerely hope they court martial his ass.
Clapping.
It was a blasted CARRIER!
WRONG MAN FOR THAT COMMAND REGARDLESS OF HIS INTENT
At that rank they know better than to do something like that. This was deliberate sabotage.
Also contagions have been dealt with pretty much since people have been sailing on the seas. Plenty of successful precedent for how to deal with this. This guy is a politico for sure.
IKR?
When word of what was going on leaked out, hubby and I both noted that shouldn’t have happened. It’s classified information – it has to do with what is called “Ship’s Movement” “Readiness” etc. Unfortunate, because it’s clear he was in a bind with the number of sick crew members, but handled badly by airing dirty laundry.
ANY contact with the media without his commanding officer’s permission is breaking the chain of command. He was acting politically – not militarily.
Sounds like an Øbominable appointee.
Good question, James.
I don’t put much stock in the videos showing hospitals “not busy”.
– Visitors discouraged, cut back, in many cases not allowed I suppose.
– Staff curtailed where possible.
– Elective surgery shut down.
– Existing hospital beds made available for emerging ChiCom-19. Regular patients sent home as soon as possible or to other hospitals without ChiCom-19.
Now, hospitals with ChiCom-19 they’ll be staffed for those patients, but we’ll not see videos of that. Who is going to let MCM walk arounf ChiCom-19 patients. Patient privacy.
So, for me, the lack of a “busy” appearance around hospitals is a red herring.
Now, the day we have patients lined up for beds or turned away, we’ll have “breaking news” video…
I agree. A couple of weeks ago, I visited someone who had to go to the ER after a fall. There were signs that prohibited photos and videos. I don’t know if that’s the policy in the rest of the hospital or in hospitals in general, but it would stand to reason under HIPAA privacy rules.
Then again, when did rules ever stop someone from taking a clandestine video? Maybe there is a risk of prosecution; I have no idea.
I haven’t dealt w/ the physec side of HIPAA but here’s a summary:
https://www.novarad.net/post/what-you-must-understand-about-hipaa-and-patient-photography
The short version is that a picture of a face, any identifying markings, etc are governed by HIPAA.
IANAL but if the video blocks/scrambles PATIENT faces and identifying marks, aka masking, then the imagery can be used without incurring a HIPAA violation.
The notion that HIPAA regulations prevent video recordings is, as best as I can tell, a mischaracteration of HIPAA by non-lawyers. In short, medical personnel are told not to use cameras because it may incur a HIPAA violation -> They in turn interpret this, incorrectly, to say HIPAA says they can’t use cameras.
If that were REALLY true that means that every patient that Skype/Facetime from a hospital room is in violation of HIPAA! Obviously that is NOT true.
Likewise, hospitals are allowed under HIPAA to record surveillance video as part of a VSS (security camera system). The system has to be protected so that only authorized personnel have access to it for official duties. It only becomes a HIPAA violation when the patient’s privacy/PHI are compromised.
As I interpret it, James O’Keefe, who has far better lawyers than I do, can record anywhere and everywhere in a hospital he wants, and provided he is intentional about masking patient PHI at all times, can for HIPAA purposes release whatever he likes.
If James O’Keefe with his hidden camera spoke with a medical worker directly, and he/she started talking and casually talked about some situation with a patient that was identifiable, THAT would be a HIPAA violation. He can, in turn, release that video, and provided the PHI is masked, and his recording would NOT be in violation of HIPAA itself, even though it may show a clear release of PHI and HIPAA violation.
Good info.
Agreed…
Also…no one is actually claiming the hospitals are overwhelmed…yet. That’s supposed to happen at some date in the future, unless the curve can be flattened.
So to argue that the hospitals are not (today) overwhelmed (even with solid evidence to that effect, which as you point out hasn’t actually been presented anyway) and therefore “they” are wrong is a straw man.
Bannon is right.
The media message is wrong from the WH.
They should have focused on the model in terms of…… “If we do nothing, this model says 2.2 million people die”
then, “As your President I’m making the decision to do this, although painful, because we need o ave millions of Americans”
And this is why we are shutting down the country.
Would have been a better message.
Because NOW, the whole message is 100-240K dead, with the President of the USA standing in front of the graph.
He did say that, both Tues and Wed. Do nothing is 2million+. April 30 extension is to reduce 100-240K. At least that’s what I’ve been hearing.
The mortal wound is the muddle
And putting the President anywhere NEAR that damn graph.
I agree with Butterfly. That is and has been the message, and the attention span issue has kicked in in the USA. The people have reverted to worrying about themselves first and foremost.
HE HAS TO EMPHASIZE the seriousness of it – to get the people to take the GUIDELINES seriously.
He has to show them how serious it is to make them understand his decision to put us through the great sacrifice of shutting down the businesses, staying home, etc.
I DO NOT UNDERSTAND WHY THEY AREN’T TALKING ABOUT HCQ AND ZITHROMAX
After getting a solid briefing about HCQ & Zpac this morning, Kilmead was pointedly asking Dr.Oz (in so many words) if it wasn’t TDS acting as a roadblock…Oz wasn’t biting.
You’ll notice…an entire Covid briefing can come and go with nary a question about HCQ. DS wants slower, more expensive, bureaucracy laden treatment than HCQ. Preferably a variety of vaccines!
And presstitudes are the mouthpieces of DS.
Potus will intervene at the right time because HCQ in some capacity is the only timely way to get out front of the epidemic. (Buying time to build stocks of the drug…?)
That was one of the very best press conferences. Just an amazing amount of information offered. Plus we saw the media’s largest pin cushion, Jared Kushner, execute a delicious takedown of a reporter. Loved it.
May I expand…
“…Jared Kushner, execute a delicious take down of a reporter AND incompetent Governors and Mayors. Governors and Mayors panicking in the face of adversity with zero management skills.
The amount of neighborhood gossip I’m getting is SO good. Forget the NYT this stuff is good.
LOL
If the Captain emailed that letter openly to the public over insecure channels, knowing it would leak to both foreign and domestic people outside the chain of command – that captain was acting politically – not militarily – and should be court martialed
Not good to “telegraph” to potentially malign governments ANY info related to military readiness. Shouldn’t be in command.
It’s worse than that.
He knew it was wrong.
He gave that information KNOWINGLY.
He is going to face courtmartial.
Promoted under that last administration?
Golden State:
Hmmmm………
Seeds……….??????????
Interesting move.
Speaks volumes.
https://twitter.com/JohnLeksander/status/1245866995431518209
This has been a Dem push for quite a while.
High Mowing Seeds is based in Vermont, and they’re claiming they’re still shipping out seed after getting a special exemption from the government. It seems this ban only applies to physical stores. That’s alarming for many reasons, but what makes it especially stupid is that seeds are considered “essential” even by the food stamp program. Yes, you can buy garden seed with food stamps. Hope Vermonters challenge this awful decision.
https://www.facebook.com/highmowingorganicseeds/photos/a.454181950663/10157922645805664/?type=3&theater
Folks should ask the President to intervene!!!
What is the point of saying this, or at least the excuse? Talk about ass clowned.
The Commies always go after the FARMS. Whether Russian or China or Zimbabwe.
” The Socialist Revolution in the US cannot take place because there are too many small independent farmers there. Those people are the stability factor. We here in Russia must hurry while our government is stupid enough to not encourage and support the independent farmership.” ~ V. Lenin, the founder of the Russian revolution
Quote provided by Anna Fisher
Cry Out of Russia…escape from darkness by Anna Fisher
Amazing letter.
LOVE this letter!!!
41 year-old El Paso Sheriff’s Deputy dies to “coronavirus.” Was it “coronavirus” or clean up from last August’s false flag?
https://www.denverpost.com/2020/04/02/colorado-coronavirus-victim-jeff-hopkins/
Could be heart trouble, diabetes, smoking related or lung disease, inherited condition…a lot of underlying health conditions
Yep. Dude was obese, probably diabetic. The fact this virus is taking out all the people with metabolic diseases hopefully will finally get people to fix their diets. Ditch the carbs/sugars.
Health care workers and cops see the worst of life and people and a lot of them eat to medicate their pain. And then they get sick…over-eating is a slow suicide.
Some people medicate their pain with drugs and/or cigarettes, another form of slow suicide.
Military seem to commit quicker suicide,
To clarify, that’s NOT El Paso or El Paso County in Texas.
That’s El Paso County, in Colorado.
Thus it has nothing to do with the El Paso Texas false flag.
I live in that county.
It threw me for a while too, but now, we have buddies like Steve in El Paso county, COLORADO.
Thank you!
Tucker tearing up and exposing 3MM – explains why POTUS invoked the NDPA against them. They’re selling their masks to foreign countries who show up with cash. No priority to us. None for America.
Also medical suppliers are still exporting to other countries. Administration alerted, POTUS needs to shut that down now. 54 other countries have stopped exports.
Wow. Almost as if it were planned. Gee.
True, he also drove all the pharmas to register overseas. We lost a ton of them to Ireland
And Mylan is overseas as well.
https://twitter.com/alison4trump/status/1245880726341455873?s=21
Who owns 3 M – are the Islamists involved?
They’re a multinational, globalist company.
Good questions. Who owns anything we thought was American 🤷♀️
That’s the problem. All the great American companies have been de-Americanized through multinationalism and globalism. All our laws are cronyism to prevent competition from re-emerging in the U.S.
We have deputies dying in CA too.
I know this one had major comorbidities.
https://ktla.com/news/local-news/riverside-county-sheriffs-deputy-dies-of-covid-19/
There’s that twisted nerd mentality surfacing again.
He doesn’t care about the Economy…or the fact that people have to get out and work.
He has his billions.
He thinks he’s set for life.
I’m not saying that ‘all nerds’ are twisted…just Gates.
Gates is a ghoul who wants people to die.
Chiefio’s, Jo Nova’s, WattsupWithThat, RealClimateScience, ClimateAudit, ScienceBits and many more are infested with nerds who care about other people. So no, only a few are sociopaths or psychopaths.
Why is he speaking to the enemy? He is the enemy!
He should be quarantined from tv !!!!!!
Fauci doesn’t care about the economy, either.
He has always gotten paid, no matter what.
This is terrific, Daughn! Probably gonna be called a racist fir calling some governors incompetent managers!!
Hehe, probably.
Do you get the idea Jared is a no-nonsense kind of a guy?
We never see him.
Hard to get a read on him.
What do you think?
He IS hard to read. I can’t imagine Ivanka marrying a guy who doesn’t emote, and maybe we’re seeing his business/game face, which I completely support! 🤓 I watched our CO governor press releases today where he touted his letter to VP Pence begging for “thousands” of everything. After watching Jared today, not only am I certain our former and current Lefty governors wasted their time/money on fighting fracking and SJW crap, but our current governor has NOT done an inventory of what we have!!! Busted by Jared 🤬🤬
All bluster for the cameras. As in, see here my constituents, look at all the hard work I’m doing for you.
Ineffective.
No serious report on state of the state.
Do you also get the feeling a few of them are jealous cuz Cuomo is getting so much attention?
Hmmm good thought on the Cuomo jealousy 🤓 Our governor schedules his press conferences at the exact same time as the President’s pressers!!! Gee, I wonder who our local Lefty-run channels are covering Grrrrrrrr
For what it’s worth, just a video found on the internet.
https://twitter.com/FollowQanon/status/1245893419089698820
He is the Chinese billionaire who blew the whistle on HSBC.
Everyone thought he was crazy…… he was right.
He’s also the one funding Bannon’s broadcast, translated into Mandarin, and broadcasted into China on the weekends.
Brave guy. Made a lot of Chinese enemies.
He’s also the one Chinese Ambassador wanted shipped BACK to China for trial. Sessions put his foot down and threatened to resign if it happened.
Yep it’s true. Hannity and Dr. Oz both confirm Cuomo has banned docs from prescribing HCQ off label. It’s almost like he wants more people to be sick and die. EVIL.
Does POTUS know ????
Unsure, I didn’t even know til today.
https://twitter.com/bflyjesusgrl/status/1245907241913507841?s=20
Way to go, Butterfly!
😀🤗👍
You tagged them all…Thanks for doing that!
Found it. Bookmark
Here are two more copies:
The Possible Origins of 2019-nCoV coronavirus by Botao Xiao
https://gofile.io/?c=D4zfxD
And here is a news report:
https://www.thenews.com.pk/print/615319-did-coronavirus-originate-in-chinese-govt-laboratory
I’m so sorry, guys. I did NOT mean for the whole thing to post.
I like posting as much as possible, more backups is more better
Thank you Gail.
https://twitter.com/alison4trump/status/1245899691784462343?s=21
Hey Daughn – just a thought … now that the Daily C-virus thread is getting more comments than daily thread, and I’m probably not the only one to wonder “where do I post this?” and “where DID xxx post that?” when trying to recall someone’s earlier comment …
1. Are we posting too much trivial or irrelevant stuff on this thread that better belongs on daily thread?
2. Is it time to go back to one daily thread since most convo is likely to be virus related?
Just asking and wondering if you’re tearing your hair out about how scattered we all are 🤓🥰😷😷😷
Thanks, Allison…I had the same thought.
😏🧐👍
Since the ChiCom Virus is affecting everything now, having two daily threads seems kind of redundant.
Well, let’s ask again tomorrow if Daughn doesn’t see this. I don’t want the Daily Thread hosts to get discouraged that number of comments is dropping and plenty of those comments are virus-related.
Daughn, herself, mentioned going back to one thread last week, but that seemed too soon. Now we know it’s gonna be a long haul!
I hear you and will let the group decide or Wolfie. Good with me.
I advocate on behalf of two threads.
Here is why.
1. Personally, I like two threads, because MOST of the virus stiff is here, and I can search and link to the big weekly threads. To link a Daily Thread would not work, see what I mean?
2. Also, many of us get to a point were we need to take a break and AVOID the virus. Daily thread is better and… nicer, mentally.
3. If we get jumbled and can’t remember where we put posts (easy to do) then logic would dictate we never need another individual subject thread. And then….. we would forget which day we posted a certain post….. so we would never need a daily thread for every day…. just one big thread.
4. This one issue will subside, the virus. Historically, it will be easier to go back and find info instead of searching through a daily.
5. The subject thread is easier to share across different platforms. It would be awkward to share out daily thread with some people.
Edit – it would be awkward to share OUR daily thread across different social media platforms.
True story. Talking about most topics we discuss are just not easy or safe-feeling topics for most people. Better that their exposure is limited to just the Coronavirus. Discussion I mean.
Sounds good! You know best what works for you, and these reasons make perfect sense!
Partly I wanted to make sure we commenters aren’t overwhelming the virus thread with virus trivia that you don’t need.
As long as you’re good, believe me, we are good 🤓 AND we are most grateful for all your efforts! Just keep us on the right track if our virus comments get in the way of your mission 🇺🇸💖🇺🇸💖
Glad you said that Alison. I was feeling a little guilty for not being creative on the Daily Virus thread. All I do is copy/paste.
BUT HEY!!!!!!!!!!
Tomorrow, we have a new subject.
CARTEL WARS!!!!!
Don’t know about you but I was happy to look at something else.
We all need a break.
Yay! I love your topical posts 🤓❤️😷😷
Daughn will let us know if we’re dumping too much here 🙂
I find unique stories every day and I can’t keep up with all the reporting.
I still haven’t posted about the June SBC Annual Meeting in any detail and how it was canceled by the SBC Evangelical Elites. They also decided to extend the SBC Presidency, you know, for the good of the Republic . . .
grrrrrrrr
Why do they always fight over religion?
Communism is a jealous god that cannot tolerate rivals.
In this case, they want to decimate the evangelical vote in 2020.
I have NOT posted even a smidge of what I know, and I’ve only scratched the surface. You’d be horrified at what’s happening in our churches here. Soros and Tim Gill and others pumping money hard into SJW, race reconciliation, anti-Trumpism, etc etc. Churches are eating it up. They’ve even managed to fool some of my friends. Others though see the sea change and are concerned.
It’s another front in the hybrid warfare: Undermine the WORLDVIEW and you do the MOST DAMAGE to the enemy.