“We do not believe any group of men adequate enough or wise enough to operate without scrutiny or without criticism. We know that the only way to avoid error is to detect it, that the only way to detect it is to be free to inquire. We know that in secrecy error undetected will flourish and subvert.” –J. Robert Oppenheimer
GREENHOUSE, ICEHOUSE OR CLIMATIC MADHOUSE? h/t Neuman and Hearty (1996)
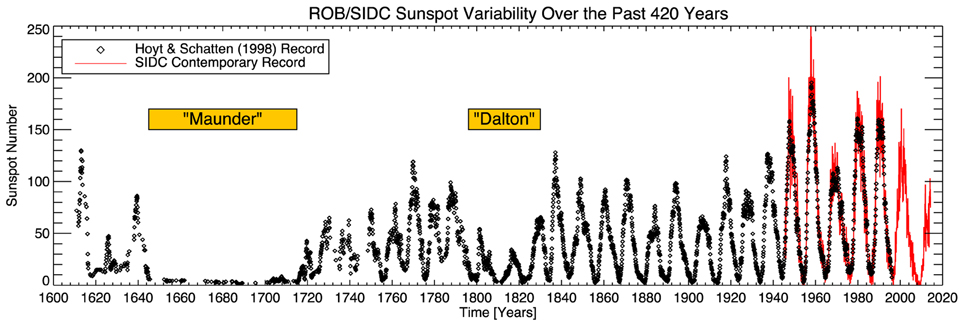
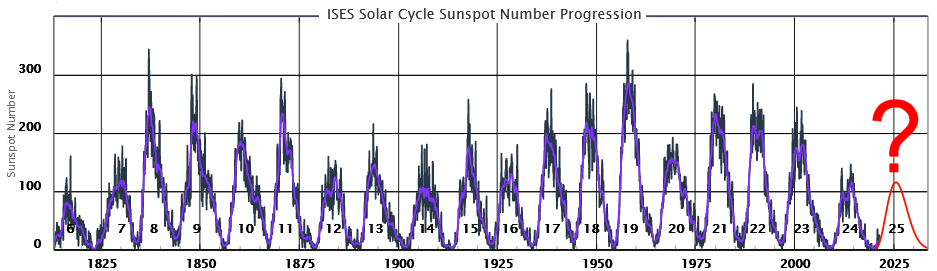
Sunspot Variability over the past 420 years using the Hoyt & Schatten 1998 record to avoid the data tampering by Leif Svalgaard of Stanford University.
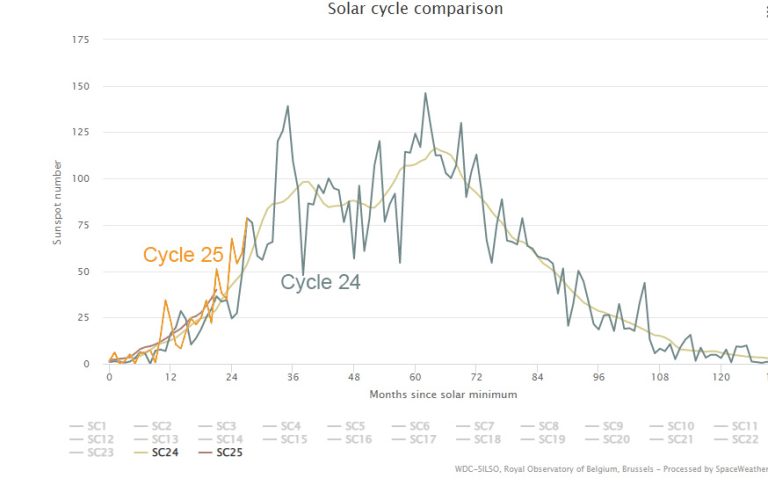
Except the current cycle is not more active than the last. (Remember Svalgaard and his fudging…)
‘They’ expected a slower increase in sun spots and Cycle 25 had a faster increase AS DID Cycle 24. So Cycle 25 is more active than ‘Their’ prediction. Look at Cycle 25 vs the start of Cycle 24 (below). This is the classic strawman argument . Set up a strawman —‘Their prediction’ and then argue Cycle 25 is ‘more active’ completely ignoring the fact that cycle 25 is similar to the weak cycle 24.
Updated to December 2022 on Space Weather Live including an overlay of both cycles. They still align.
SYNOPSIS:
Like 1913, the late 1960s & early 1970s were a pivotal time period.
* In 1967 Gleissberg published Secularly smoothed data on the minima and maxima of sunspot frequency showing a ~80 year sunspot cycle.
* In 1968 Mikhail Budyko came up with two mathematical models, one predicted an Ice Age, the other Global warming from the Greenhouse Effect.
* In 1969, grain stores decreased and by 1972 had plummeted to crisis levels, that, according to the CIA, country leaders went to great pains to hide.
* In 1970, Broecker, using new radioactive decay dating methods (oxygen isotopes,) identified and dated five full ice age cycles. He stated his work was in agreement with the 1911 Milankovitchcycles. (Hays and Shackleton expanded on this. And published in 1972.)
*In 1974 a CIA report warned ”…there is considerable evidence that these empires may not have been undone by barbarian invaders but by climatic change…. has tied several of these declines to specific global cool periods, major and minor…” To the Cabal that is a serious OH! SCHIFF!
So let’s take a look at the sun, geology and then the Cabal’s response, keeping in mind that at the time NATO (1), the CIA (2) and Big Pharma (3) were all filled with Nazis and our buddies Kissinger and David Rockefeller were orchestrating a lot of the US government responses. I hope this article helps explain the panic we are seeing. Normally they would just block POTUS Trump and wait him out, but I think they decided they do not have time before TSHF.
>>>>>>>>>>>>>>>>
I am going to get into the ‘weeds’ a bit. Whether YOU believe it, or the Sheeple believe it does not matter. It is what the Cabal, thinks of the information that matters. There is NO WAY the Cabal believes the global warming crap they spew. Otherwise they would NOT be buy homes on the seashore. Remember they have information and scientific studies that never see the light of day.
The climate of the earth appears to be ‘bi-stable’ oscillating between a stable warm phase and a stable cold phase with periods of ‘Climatic Madhouse’ mainly during transitions and the cold phase.
Note that in this chart the “present day” is to the left and MS 11, a possible Holocene analog, showing the double precession peak, is to the far right (400,000 yrs ago) Also the numbering is odd numbers are warm periods. The Holocene is MS1 and the Eemian is MS 5. MS 3 between the Holocene and the Eemian never really made it to ‘warm.’
…The main ice core, the subject of this post, was drilled in 1995. The Vostok ice core is 3310 m long and represents 422,766 years of snow accumulation. One year is therefore represented by only 7.8 mm of ice. Vostok is a cold, cold desert and the very slow ice accumulation rate introduces significant uncertainties to the data….
Euan Means
The fact that Vostok antarctic is a cold DESERT is an important point we will get back to in another article.
If we zero in to just the glaciation between the Holocene and the Eemian.
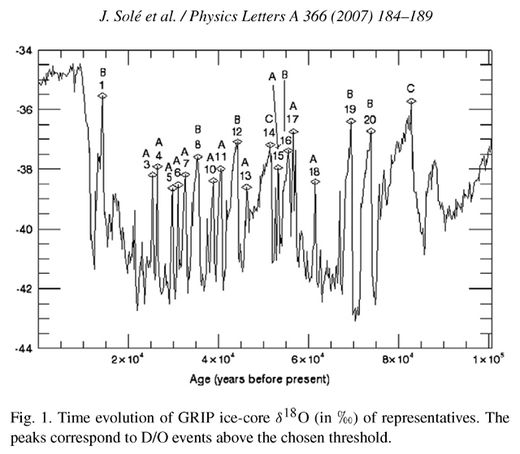
…between this interglacial and the last one back, the Eemian, we find in the Greenland ice cores that there were 24 Dansgaard-Oeschger oscillations (Figure 5, originally figure 1. Sole et al, 2007), or abrupt warmings that occurred from just a few years to mere decades that average between 8-10C rises (D-O 19 scored 16C). The nominal difference between earth’s cold (glacial) and warm (interglacial) states being on the order of 20C. D-O events average 1470 years, the range being 1-4kyrs….
The Wisconsin glacial, which preceded the Holocene, the interglacial in which all of human civilization has occurred, is littered with ACC. D-O oscillations average 1,500 years, and have the same characteristic sawtooth temperature shape that the major ice-age/interglacials do, a sudden, dramatic, reliable, and seemingly unavoidable rise of between 8-10C on average, taking from only a few years to mere decades, then a shaky period of warmth (less than interglacial warmth), followed by a steep descent back into ice age conditions. Each D-O oscillation is slightly colder than the previous one through about seven oscillations; then there is an especially long, cold interval, followed by an especially large, abrupt warming up to 16C (a Bond cycle). During the latter parts of the especially cold intervals, armadas of icebergs are rafted across the North Atlantic (Heinrich events), their passage recorded reliably by the deep ocean sediment cores which capture the telltale signature of these events in dropstones and detritus melted out of them.
“The ice age ended in one year” according to Dorthe Dahl-Jensen, professor at the Center for Ice and Climate at the Niels Bohr Institute at the University of Copenhagen…
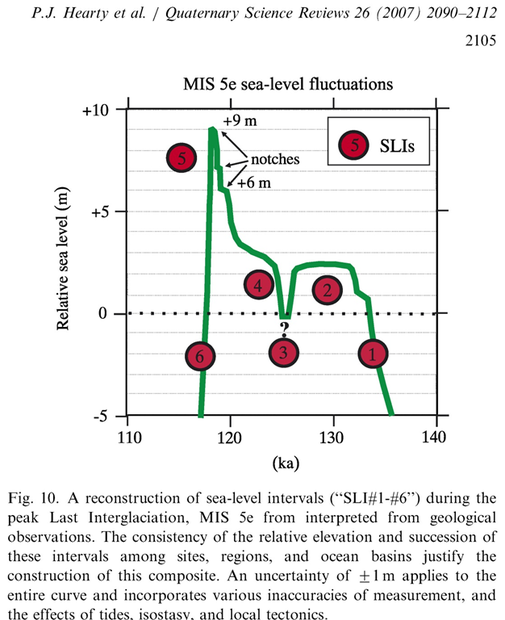
“The geology of the Last Interglaciation (sensu stricto, marine isotope substage (MIS) 5e) in the Bahamas records the nature of sea level and climate change. After a period of quasi-stability for most of the interglaciation, during which reefs grew to +2.5 m, sea level rose rapidly at the end of the period, incising notches in older limestone. After brief stillstands at +6 and perhaps +8.5 m, sea level fell with apparent speed to the MIS 5d lowstand and much cooler climatic conditions. It was during this regression from the MIS 5e highstand that the North Atlantic suffered an oceanographic ”reorganization” about 118.73 ka ago. During this same interval, massive dune-building greatly enlarged the Bahama Islands. Giant waves reshaped exposed lowlands into chevron-shaped beach ridges, ran up on older coastal ridges, and also broke off and threw megaboulders onto and over 20 m-high cliffs. The oolitic rocks recording these features yield concordant whole-rock amino acid ratios across the archipelago. Whether or not the Last Interglaciation serves as an appropriate analog for our ”greenhouse” world, it nonetheless reveals the intricate details of climatic transitions between warm interglaciations and near glacial conditions.”
Hearty and Neuman
It is not just Hearty and Neumann who point out this “Climatic Madhouse”
McClenney: “…Higher resolution proxy studies from many parts of the planet suggest that the end interglacials may be quite the wild climate ride from the perspective of global climate disruption.…” Boettger, et al (Quaternary International 207 [2009] 137 – 144) abstract it:
“In terrestrial records from Central and Eastern Europe the end of the Last Interglacial seems to be characterized by evident climatic and environmental instabilities recorded by geochemical and vegetation indicators. The transition (MIS 5e/5d) from the Last Interglacial (Eemian, Mikulino) to the Early Last Glacial (Early Weichselian, Early Valdai) is marked by at least two warming events as observed in geochemical data on the lake sediment profiles of Central (Gro¨bern, Neumark – Nord, Klinge) and of Eastern Europe (Ples). Results of palynological studies of all these sequences indicate simultaneously a strong increase of environmental oscillations during the very end of the Last Interglacial and the beginning of the Last Glaciation. This paper discusses possible correlations of these events between regions in Central and Eastern Europe. The pronounced climate and environment instability during the interglacial/glacial transition could be consistent with the assumption that it is about a natural phenomenon, characteristic for transitional stages. Taking into consideration that currently observed ”human-induced” global warming coincides with the natural trend to cooling, the study of such transitional stages is important for understanding the underlying processes of the climate changes.”
Boettger et al
So a quick take away is that interglacial warm periods are relatively stable. The transition stages to glaciation are a ‘Madhouse’ and even during glaciation, you get periodic ‘Climatic Madhouse’ conditions.
There is one interglacial MIS-11 (or the Holsteinian) which may have lasted on the order of 20-22kyrs, with the longest estimate ranging up to 32kyrs. This was a double precession cycle and some think it is an analog for the Holocene. That is that the Holocene will go ‘long’
McClenney comments “…Looking at orbital mechanics and model results, Loutre and Berger (2003) in a landmark paper (meaning a widely quoted and discussed paper) for the time predicted that the current interglacial, the Holocene, might very well last another 50,000 years, particularly if CO2 were factored in…. Loutre and Berger’s 2003 paper was soon followed by another landmark paper by Lisieki and Raymo (Oceanography, 2005), an exhaustive look at 57 globally distributed deep Ocean Drilling Project (and other) cores (Figure 1), which stated:”
“Recent research has focused on MIS 11 as a possible analog for the present interglacial [e.g., Loutre and Berger, 2003; EPICA community members, 2004] because both occur during times of low eccentricity. The LR04 age model establishes that MIS 11 spans two precession cycles, with 18O values below 3.6o/oo for 20 kyr, from 398-418 ka. In comparison, stages 9 and 5 remained below 3.6o/oo for 13 and 12 kyr, respectively, and the Holocene interglacial has lasted 11 kyr so far. In the LR04 age model, the average LSR of 29 sites is the same from 398-418 ka as from 250-650 ka; consequently, stage 11 is unlikely to be artificially stretched. However, the June 21 insolation minimum at 65N during MIS 11 is only 489 W/m2, much less pronounced than the present minimum of 474 W/m2. In addition, current insolation values are not predicted to return to the high values of late MIS 11 for another 65 kyr. We propose that this effectively precludes a ‘double precession-cycle’ interglacial [e.g., Raymo, 1997] in the Holocene without human influence.”
Lisieki and Raymo
So the Loutre and Berger model is trashed by the real life data of Lisieki and Raymo. However Grant $$$MONEY$$$ talks so Dr Lisiecke jumps onto WUWT to save her grants.
As the author of this study, I would like to clarify a couple points.
(1) This study specifically deals with the last million years. It does not include any analysis of the warming trend of the last century, which is much faster than changes that would be produced by slow changes in Earth’s orbit over tens of thousands of years. [SEE A History of Solar Activity over Millennia BELOW] The current changes in orbit would be expected to cause gradual cooling over the next ~90,000 years.
(2) The new results in this study are finding (a) a statistically significant correlation between climate and eccentricity specifically and (b) a negative correlation in the strength of the cycles. This suggests that the primary reason we have 100,000-yr glacial cycles is internal instability within the climate system. Eccentricity appears to affect the timing of these changes and (in some cases) weaken them.
REPLY: Ms. Lisiecki, thank you for taking the time to comment here and to add additional insights. – Anthony Watts
Lorraine Lisiecki
Notice she CHANGES the actual conclusion of the paper, the Holocene matches the SECOND precession cycle and therefore the earth is at the end of the Holocene to “…gradual cooling over the next ~90,000 years….” BECAUSE OF “…human influence.” ←SNEAKY!
From the point of view of the Cabal, gradual cooling, a second Little Ice Age, or a full blown Ice Age, the solution is the same ‘POPULATION CONTROL’ a euphemism for De-population.
At this point I want to introduce five very important people.
First Yugoslavian professor of mathematics, Milutin Milankovitch. Around 1911, he linked the orbits and planetary tilt of Earth to climate. SIMPLE EXPLANATION
A short piece by Nigel Calder on “…the “change in perspective” that Roe adopts was available more than 30 years earlier…” I am fairly sure ‘forgetting’ to use “the rate of change in global ice volume..” was deliberate since it allowed Milankovitch to be ‘proven wrong’ Milankovitch and the ice ages – welcome back to 1974
Second & third are Hays and Shackleton, who, in in 1972 published the paper with the evidence to support Milankovitch’s theory. They were not the first but their paper was the most accepted.
Ice Ages Confirmed by Alan Feuerbacher is a superb history of this historic breakthrough and the confirmation of the Milankovitch Cycles. It is an enjoyable read. If you have kids I suggest you read it to them to counter the crap they are taught in school.
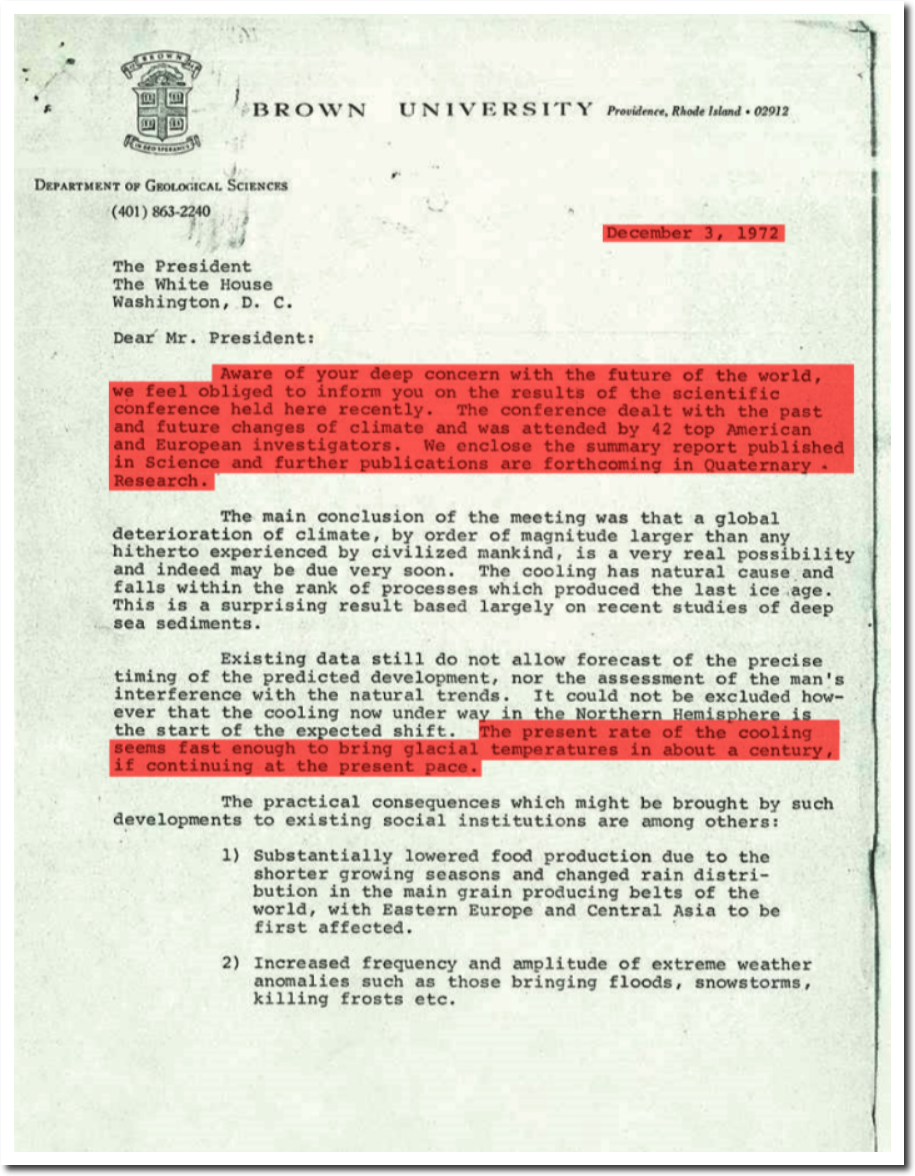
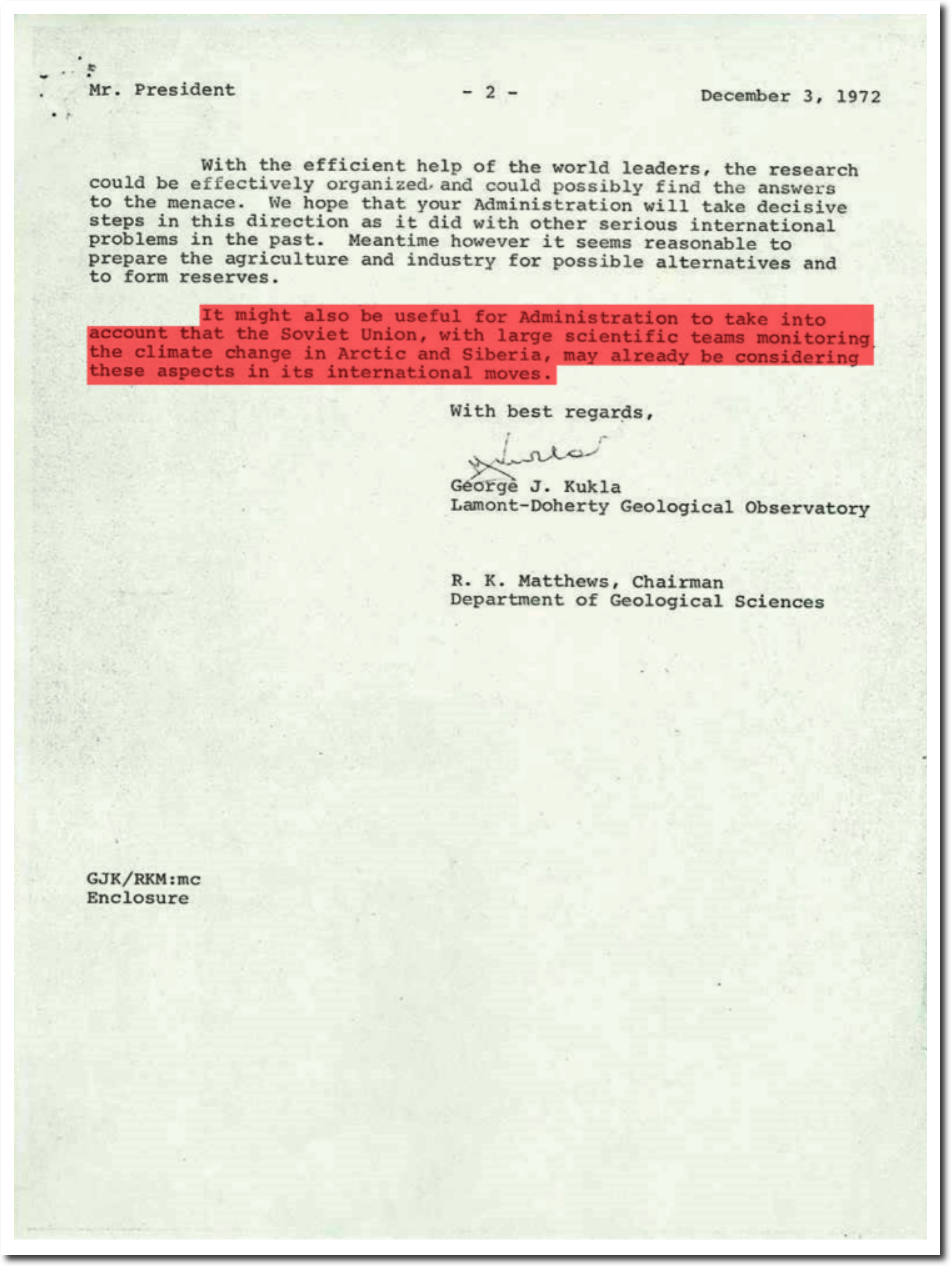
A fourth, much less famous person is George Kukla, who, along with others, wrote to President Nixon.
In the 1960s a respected geologist in his native Czechoslovakia, George Kukla, counted the layers of loess – windblown mineral dust ground by the glaciers and laid down in the region during recent ice ages. They were separated by darker material left over from warm interglacial periods. Kukla found too many layers of loess. Until then, almost everyone thought that there were just four recent glacial ages, with long interglacials between them. An exception was Cesare Emiliani, who in Chicago in 1955 had traced major variations in heavy oxygen in seabed fossils, and counted seven ice ages. Very few experts believed him until Kukla reported at least nine loess layers in the brickyards of Czechoslovakia…..
Kukla and Matthews alerted President Richard Nixon, and as a result the US Administration set up a Panel on the Present Interglacial involving the State Department and other agencies. [THINK CIA] None of us knew then that the mid-century cooling was about to be punctuated by a warming spell from the late 1970s to the mid 1990s….
More recently in 1995, Kukla again “..contends that orbit drives climate.”
August 19, 2012 ….The solar cooling is now predicted by NASA’s Long Range Solar Forecast through 2022 and as well as the stunning slowdown of sun’s activity.
Weighing in on the idea of an impending Ice Age, one of the world’s top climate experts, George Kukla, a retired professor of paleoclimatology from Columbia University and researcher at the Lamont-Doherty Earth Observatory says the “Earth has experienced an ongoing cycle of ice ages dating back millions of years. Cold, glacial periods affecting the polar to mid-latitudes persist for about 100,000 years, punctuated by briefer, warmer periods called interglacials.” He contends that orbit drives climate. Added to the current cycle of the sun, the picture isn’t comforting.
Paleoclimatology expert, Professor emeritus George Kukla
The co-author of an important section of the book “Natural Climate Variability on Decade to Century Time Scales,” [1995] Kukla asserts all Ice Ages start with a period of global warming. They’re the harbingers of new Ice Ages. Actually, he explains, warming is good. Ice Ages are deadly and can kill millions…. LINK
When I introduced the method of secular smoothing into the study of the variations of sunspot frequency (GLEISSBERG, 1944) I published a table containing the secularly smoothed epochs and ordinates of sunspot minima and maxima which I had deduced from the data published by BRUNNER in 1939. Since then, secular smoothing has proved to be one of the principal methods for investigating the properties of the 80-year cycle of solar activity (cf. RUBASHEv, 1964).
W. Gleissberg
THE GLIESSBERG CYCLE IS KEY TO THE WHOLE GLOBAL WARMING SCAM!
After all if you are a member of the Cabal, you do not want the Great Unwashed cluttering up the choice pieces of land. Much better to send them scurrying in the opposite direction by telling them it is going to get WARMER and not that it is actually going to get colder.
I am going to introduce one other solar paper that has become very important in recent years. I think this is the paper that really scared the Cabal. It came out a few years after Lisieki and Raymo and produced the real reason for the earth warming out of the Little Ice Age.
I am a big fan of Usokin and his 2008 paper because he uses multiple data sets and not just one to arrive at his conclusions. It actually was not that hard to read either. That he takes a swipe at Svalgaard is just icing on the cake (snicker.)
From the 2016 paper:
…Quasi-periodicities and characteristic times
Although the variability of solar activity in Fig. 20 looks random at first look, some weak quasi-periodicities can be suggested, as discussed in Sect. 2.4. A simple periodicity analysis yields several peaks in the range of periods between 80 and 150 years (cf., Peristykh and Damon 2003), corresponding to the frequency band of the Gleissberg cycle (Ogurtsov et al. 2002). The de Vries/Suess cycle, with a period of about 210 years, forms a prominent in the power spectrum, but it is intermittent and tends to become strong with around 2400 clustering time (Usoskin and Kovaltsov 2004). Another variation with a period of around 350 years can be observed after 6000 BC (cf. Steinhilber et al. 2012). Variations with a characteristic time of 600–700 years are intermittent and can be hardly regarded as a typical feature of solar activity. There is also a weak millennial quasi-periodicity with the period of 1000–1200 years called Eddy cycle (Steinhilber et al. 2012).
Of special interest is the 2000–2400 year Hallstatt cycle (see, e.g., Vitinsky et al. 1986; Damon and Sonett 1991; Vasiliev and Dergachev 2002), which is relatively stable and mostly manifests itself as a modulation of long-term solar activity, leading to the clustering of grand minima (Usoskin et al. 2016a). Although its possible terrestrial origin (geomagnetic or climate) was discussed earlier (Vasiliev and Dergachev 2002; Vasiliev et al. 2012), it is shown by Usoskin et al. (2016a) to have solar origin.
In particular, grand minima and maxima tend to cluster around highs and lows of the Hallstatt cycle….
However, as we can securely say now, after the very weak solar minimum in 2008–2009 (e.g., Gibson et al. 2011), solar activity returns to its normal moderate level in cycle # 24. Thus, the high activity episode known as the Modern grand maximum is over.
Is such high solar activity typical or is it something extraordinary? While it is broadly agreed that the modern active sun episode is a special phenomenon, the question of how (a)typical such upward bumps are from “normal” activity is a topic of hot debate….
Usoskin et al. (2003c, 2004) stated that the modern maximum is unique in the last millennium. Then, using a similar analysis of the 14C calibrated series, Solanki et al. (2004) found that the modern activity burst is not unique, but a very rare event, with the previous burst occurring about 8 millennia ago.
An update (Usoskin et al. 2006a) of this result, using a more precise paleo-magnetic reconstruction by Korte and Constable (2005) since 5000 BC, suggests that an increase of solar activity comparable with the modern episode might have taken place around 2000 BC, i.e., around 4 millennia ago, in agreement with more recent studies by Steinhilber et al. (2012) and Inceoglu et al….
Usoskin et al
TRANSLATION:
Gleissberg did indeed identify a short (80 to 150 yr) solar cycle. AND the earth has just gone through a RARE GRAND SOLAR MAXIMUM that occurs maybe once ever four to eight thousand years. A Solar Maximuim that lifted the earth out of the Little Ice Age AND THAT HIGH ACTIVITY HAS ENDED. This explains Lorraine Lisiecki ‘s “…warming trend of the last century …” If you already know the CO2 causes warming is complete bull schiff, that is NOT information you want to hear.
According to Usoskin et al. (2014), the Sun “shows strong variability in its magnetic activity, from Grand minima to Grand maxima…
Now, however, in an attempt to overcome such uncertainties, Usoskin et al. “present the first fully adjustment-free physical reconstruction of solar activity” covering the past 3,000 years, which record allowed them “to study different modes of solar activity at an unprecedented level of detail.”…..
Unfortunately, it was beyond the scope of this paper to address the potential impact of solar activity on climate. Yet the reconstruction leaves a very big question unanswered — What effect did the Grand maximum of solar activity that occurred between 1950 and 2009 have on Earth’s climate? As a “unique” and “rare” event in terms of both magnitude and duration, one would think a lot more time and effort would be spent by the IPCC and others in answering that question. Instead, IPCC scientists have conducted relatively few studies of the Sun’s influence on modern warming, assuming that the temperature influence of this rare and unique Grand maximum of solar activity, which has occurred only once in the past 3,000 years…
CO2Science
This confirms the sun’s influence. Ice cores from the Freemont Glacier show it went from Little Ice Age cold to Modern Warming warm in the ten years between 1845 and 1855.
An ice core removed from the Upper Fremont Glacier in Wyoming provides evidence for abrupt climate change during the mid-1800s….
At a depth of 152 m the refined age-depth profile shows good agreement (1736±10 A.D.) with the 14C age date (1729±95 A.D.). The δ18O profile of the Upper Fremont Glacier (UFG) ice core indicates a change in climate known as the Little Ice Age (LIA)….
At this depth, the age-depth profile predicts an age of 1845 A.D. Results indicate the termination of the LIA was abrupt with a major climatic shift to warmer temperatures around 1845 A.D. and continuing to present day. Prediction limits (error bars) calculated for the profile ages are ±10 years (90% confidence level). Thus a conservative estimate for the time taken to complete the LIA climatic shift to present-day climate is about 10 years, suggesting the LIA termination in alpine regions of central North America may have occurred on a relatively short (decadal) timescale.
“…climatic shift to warmer temperatures around 1845 A.D…”Note solar cycle 8 . Dr Evans, husband of Jo Nova suggests there is a one solar cycle (10 – 13 year) lag in the Climate’s response to the sun. SEE: Notch-Delay Solar Theory This decadal shift makes the solar cycles and the Freemont Glacier melting line up. Given the size of earth’s oceans this makes sense.
>>>>>>>>>>>>>>>>>
Every ice-age began when CO2 was at or near peak levels, in other words, high CO2 levels were not enough to prevent ice ages. So an aside on the solar energy vs CO2 debate in case you want evidence to bash your ‘Hothouse Earther’ friends with.
…. Solar energy reached a summer maximum (9% higher than at present) ~11 ka ago and has been decreasing since then, primarily in response to the precession of the equinoxes. The extra energy elevated early Holocene summer temperatures throughout the Arctic 1-3°C above 20th century averages,…
…..Radiative transfer models calculate that the increase in CO2 since 1750 corresponds to a global annual-mean radiative forcing at the tropopause of 1.82 ± 0.19 W m−2 (ref. 2)…. the increase, between 2000 and 2010, of 22 parts per million atmospheric CO2… show statistically significant trends of 0.2 W m−2 per decade (with respective uncertainties of ±0.06 W m−2 per decade and ±0.07 W m−2 per decade)….
Feldman et al
For a DOUBLING of CO2 levels from 300 ppm to 600 ppm, it is an increase of 13.6 X 22 ppm CO2. With an increase of 0.2 W/m2 for every 22 ppm increase in CO2. a 300 ppm to 600 ppm increase would be 13.6 X 0.2 W/m2 = 2.7 W/m2. Of course that ignores the logarithmic relationship .
From the Arctic paper, with our current surface solar insolation of 479 W/m2 @ 21 June @ 65◦ N — 9% higher would be 43 W/m2. Some how a DECREASE of 43 W/m2 makes a max INCREASE of 2.7 W/m2 from CO2 look a wee bit wimpy don’t you think? It is not even enough to get us back to Holocene Optimum conditions.Dr Happer and Dr Evan completely trash the CO2 warming schlick btw. I had the pleasure of attending a guest physics class by Dr Happer. LINK
MIS 17 – insolation = 477 W m−2, with the CO2 = 240 ppmv
To give you a feel for how close to glaciation we are, you can look at the calculations from NOAA (Berger):
depth of the last ice age – around 463 Wm−2 NOW (modern Warm Period) 476 Wm-2 Holocene peak insolation: 522.5 Wm-2
The earth is a heck of a lot closer to glaciation than it is to peak warming and the Cabal darn well knows it!
POPULATION CONTROL
The weeds got really thick on this subject so I plan to do another separate article. However here is some of the information.
RAMIFICATIONS:
In the early 1970s the Gleissberg cycle could be used to PREDICT ABOUT 4 DECADES OF WARMING… Hence Maurice Strong and the 1972 Earth Summit
It is instructive to read Strong’s 1972 Stockholm speech and compare it with the issues of Earth Summit 1992. Strong warned urgently about global warming, the devastation of forests, the loss of biodiversity, polluted oceans, the population time bomb. Then as now, he invited to the conference the brand-new environmental NGOs [non-governmental organizations]: he gave them money to come; they were invited to raise hell at home. After Stockholm, environment issues became part of the administrative framework in Canada, the U.S., Britain, and Europe.
http://www.afn.org/~govern/strong.html
Strong explained:“Licences to have babies incidentally is something that I got in trouble for some years ago for suggesting even in Canada that this might be necessary at some point, at least some restriction on the right to have a child.” Strong himself has five children.”
Meanwhile as the general public was being gaslit in 1972, into thinking CO2 emissions from civilization were causing global warming…. The 1969 FOOD CRISIS and fear of a coming ICE AGE lead to the 1974 CIA Report; the Rockefeller Commission Report, and the National Security Study Memorandum.
In 1972 the Intelligence Community was faced with two issues concerning climatology:
* No methodologies available to alert policymakers of adverse climatic change
* No tools to assess the economic and political impact of such a change….
… Since 1972 the grain crisis has intensified…. Since 1969 the storage of grain has decreased from 600 million metric tons to less than 100 million metric tons – a 30 day supply… many governments have gone to great lengths to hide their agricultural predicaments from other countries as well as from their own people…
[page 9]
The archaeologists and climatotologists document a rather grim history… There is considerable evidence that these empires may not have been undone by barbarian invaders but by climatic change…. has tied several of these declines to specific global cool periods, major and minor, that affected global atmospheric circulation and brought wave upon wave of drought to formerly rich agricultural lands.
Refugees from these collapsing civilizations were often able to migrate to better lands… This would be of little comfort however,… The world is too densely populated and politically divided to accommodate mass migration….
[Page 18 talks of coming glaciation.]
Scientists are confident that unless man is able to effectively modify the climate, the northern regions… will again be covered with 100 to 200 feet of ice and snow. That this will occur within the next 2,500 years they are quite positive; that it may occur sooner is open to speculation.
page 22
The climate of the 1800s was far less favorable for agriculture in most areas of the world. In the United States during that century, the midwest grain-producing areas were cooler and wetter and snow lines of the Russian steppes lasted for longer periods of time. More extended periods of drought were noted in the areas of the Soviet Union now known as the new lands. More extensive monsoon failures were common around the world, affecting in particular China, the Philippines and the Indian Subcontinent.
The Wisconsin analysis questions whether a return to these climate conditions could support a population that has grown from 1.1 billion in 1850 to 3.75 billion in 1970. The Wisconsin group predicted that the climate could not support the world’s population since technology offers no immediate solution. Further world grain reserves currently amount to less than one month; thus any delay in supplies implies mass starvation. They also contended that new crop strains could not be developed over night… Moreover they observed that agriculture would become even more energy dependent in a world of declining resources.…
1974 CIA report
Remember Maurice Strong and the United Nations were screaming about Global Warming as this report was written.
Political leaders were invited for the first time to Davos in January 1974. >>> Two years later, the organization introduced a system of membership for ‘the 1,000 leading companies of the world’. The European Management Forum was the first non-governmental institution to initiate a partnership with China’s economic development commissions, spurring economic reform policies in China.
Maurice Strong was the founding father and first director of the UN Environment Programme and Secretary General of the 1972 UN Conference on the Human Environment.
…I am deeply saddened that Maurice Strong passed away yesterday at the age of 86. He was one of the most extraordinary personalities I ever met.
He deeply incorporated the World Economic Forum’s mission of improving the state of the world into everything he did. He was a great visionary, always ahead of our times in his thinking. He was my mentor since the creation of the Forum: a great friend; an indispensable advisor; and, for many years, a member of our Foundation Board. Without him, the Forum would not have achieved its present significance.
Klause Schwab
Obama’s Science Czar, John Holden and the other Malthusians from Stanford University were not alone. The US government has been behind them since WELL BEFORE the book Human Ecology: Problems and Solutions (1973) was published. The book just echoed the real thoughts of the US government and the Cabal.
One of the most serious challenges to human destiny in the last third of this century will be the growth of the population. Whether man’s response to that challenge will be a cause for pride or for despair in the year 2000 will depend very much on what we do today. If we now begin our work in an appropriate manner, and if we continue to devote a considerable amount of attention and energy to this problem, then mankind will be able to surmount this challenge as it has surmounted so many during the long march of civilization.
National Security Study Memorandum NSSM 200 Implications of Worldwide Population Growth For U.S. Security and Overseas Interests (THE KISSINGER REPORT) December 10, 1974 (123 pgs) “..General Goals and Requirements for Dealing With Rapid Population Growth...”
This report is very long and written in bafflegab. It take two pages where one sentence would do. Also there is a lot of additional information that should be looked at in conjunction with this report to get a clearer picture. Therefore I am going to write a separate article just dealing with this report, the Rockefellers, Eugenics, Nazis and that whole tangled mess.
A widely-used vegetation-based climate classification system, the Koppen climate classification system, was created by Wladimir Koppen, a German botanist.
This classification would be similar to the USDA Plant Hardiness Zone Map (based on the average annual minimum winter temperature, divided into 10-degree F zones.) with rainfall added so deserts and tropical rain forests would be differenciated.
This is the Koppen climate boundaries for the US Midwest during the 20th century.
If you look at the bottom graph, you can see there is a ~170 mile shift north from the 1970s decade until the 1990s. (In Kansas, the distance from northern border to southern is about 210 miles) Think what a 100 to 150 mile decrease does to Canadian, Russian and Chinese food production. The Ukraine, breadbasket of Europe, looks valuable in that context doesn’t it?
‘Hothouse Earthers’ should hang around in Scotland for a summer ( this summer) … from the Borders to the Highlands, Summer fruit crops grown outdoors have NOT done as well as you would have expected from an ever heating climate. The nights were COLD, not cool, fruit was shed or shrivelled, Maize ( sweetcorn to the ‘Hothouse Earthers’ Greenblob) did NOT survive this year – from 5-6ft high last year to less than 5 to 6 INCHES this year, says it all. ….
>>>>>>>>>
RETURN TO LITTLE ICE AGE CONDITIONS
Although no one will mention the possibility of glaciation, there has been mention of a return to Little Ice Age conditions.
Among the long list of scientific papers suggesting that a solar-driven spell of global cooling is on the cards, Dr Theodor Landscheidt’s ‘New Little ICE Age Instead of Global Warming?‘ probably has the claim of priority.
Published in 2003, just a year before his death, Landscheidt’s research is standing the test of time, and is still largely on course to be proved correct….
Dr Landscheidt gets thoroughly bashed by Svalgaard. When people at WUWT wanted to call the coming solar minimum the Landerscheidt Minimum Svalgaard tossed a hissy fit and INSISTED it be called the Eddy Minimum. Interesting that those people eventually got tossed off WUWT or left. In my opinion WUWT is a ‘Limited Hangout’ controlled by Svalgaard. He writes the most comments last I checked years ago.
Russian Astrophysicist Dr. Habibullo Abdussamatov, who is the head of space research for the Pulkovo Observatory at the Russian Academy of Sciences, in a new study, claims the “new Little Ice Age” started at the end of 2015 due to low solar activity, kicking off decades of “deep cooling” in the latter half of the 21st Century…
“The quasi-centennial epoch of the new Little Ice Age has started at the end 2015 after the maximum phase of solar cycle 24. The start of a solar grand minimum is anticipated in solar cycle 27 ± 1 in 2043 ± 11 and the beginning of phase of deep cooling in the new Little Ice Age in 2060 ± 11. The gradual weakening of the Gulf Stream leads to stronger cooling in the zone of its action in western Europe and the eastern parts of the United States and Canada. Quasi-bicentennial cyclic variations of TSI together with successive very important influences of the causal feedback effects are the main fundamental causes of corresponding alternations in climate variation from warming to the Little Ice Age…”
Lead author Omrani is reported to have said that the expected warming pause “gives us time to work out technical, political and economic solutions before the next warming phase, which will take over again from 2050”.
Very few however want to get into whether we are at the end of the Holocene. The earth is uncomfortably close to the N65 summer solstice insolation value that was the threshold for the glacial inception of the Wisconsin Ice Age. It took only two decades to ‘LEAP’ from the Eemain into the Wisconsin Ice Age.
“The onset of the 𝗟𝗘𝗔𝗣 [ late Eemian aridity pulse] 𝗼𝗰𝗰𝘂𝗿𝗿𝗲𝗱 𝘄𝗶𝘁𝗵𝗶𝗻 𝗹𝗲𝘀𝘀 𝘁𝗵𝗮𝗻 𝘁𝘄𝗼 𝗱𝗲𝗰𝗮𝗱𝗲𝘀, demonstrating the existence of a sharp threshold, which must be near 416 Wm2, …Insolation will remain at this level slightly above the glacial inception for the next 4,000 years before it then increases again.”
Sirocko & Seelos
Or more fully:
Investigating the processes that led to the end of the last interglacial period is relevant for understanding how our ongoing interglacial will end, which has been a matter of much debate (see, for example, refs 1,2). A recent ice core from Greenland demonstrates climate cooling from 122,000 years ago3 driven by orbitally controlled insolation, with glacial inception at 118,000 years ago4–8.
Here we present an annually resolved, layer-counted record of varve thickness, quartz grain size and pollen assemblages from a maar lake in the Eifel (Germany), which documents a late Eemian aridity pulse lasting 468 years with dust storms, aridity, bushfire and a decline of thermophilous trees at the time of glacial inception. We interpret the decrease in both precipitation and temperature as an indication of a close link of this extreme climate event to a sudden southward shift of the position of the North Atlantic drift, the ocean current that brings warm surface waters to the northern European region.
The late Eemian aridity pulse occurred at a 658 N July insolation of 416 Wm22 , close to today’s value of 428 Wm22 (ref. 9), and may therefore be relevant for the interpretation of present-day climate variability …
The interglacial immediately before the LEAP was characterized by temperate forests for a duration of 10 kyr (ref. 18) (the Eemian sensu stricto), which was recently U/Th-dated from about 127 to 117 kyr BP (ref. 19). The end of the Eemian was associated with a global sea level drop, dated at 118 ^ 1 kyr BP (ref. 7). This was the last glacial inception (LGI), when continental glaciers first started to grow. Fully coupled ocean and atmosphere climate models have recently studied this initial growth of ice and corroborated that the severe decrease in Northern Hemisphere insolation is fully sufficient to initiate this inception and growth of ice at 118 kyr BP (refs 5,6)…
Sirocko & Seelos
That is a heck of a long time to be sitting on the edge of a cliff waiting for other factors such as massive volcanic action or nuclear war to push the earth into glaciation. And as I showed above a N July insolation of 416 Wm22 is not set in stone and varies from interglacial inception to interglacial inception.
So the real debate is if the second precession cycle of MS13 or the first is a good analog for the Holocene. Either way, COOLING is bad for food production and ‘keeping the serfs happy’ Therefore the Cabal is well aware that drastic population culling will help keep their heads attached…. IF we do not catch them at it.
Wait until you see the rest of these articles. THEY ARE DAMNING! So do not miss them even if all you do is skim them.
The Rockefellers and their buddies embarked on a Psy-op to change the USA starting in the late 1800s and with used this 1970s cold spell to get the rest of the world leaders on board.
They used religious ties as a cover to meet their ends as well. But you already know that and I will stand down since I am anxiously awaiting your research.
They are ghouls, Well deserving of long, painful, tortuous deaths. My faith says to stay out of that, let God handle it as He instructs. But I am human and enraged.
Nice work, Gail! I don’t understand all the science presented here, but I definitely get the drift of what is going on. Just want to let you know that the graphic isn’t showing in the section where you mention “Koppen climate boundaries for the US Midwest.” There is a great big white space there, even after several refreshes.
Solar Minimum of Cycle 13 (116 years ago) was the last time Australian wheatbelts had it this tough, as a severe drought shaves more that 20% off domestic grain production.
Australia is normally the biggest wheat exporter in the Southern Hemisphere, but the prolonged drought has fried its grain crop in recent years. In 2018, output tumbled 20% to just over 17 million tonnes, the lowest in more than a decade, according to the US Department of Agriculture.
On May 9, 2019 the Australian government had no choice but to import 60,000 tons of wheat from Canada.
Cuppa Covfefe brought this great piece of evidence to the Qtree on August 12, 2023 15:02
And from the darkfutura article I quoted above, guess who owns the weather graphics companies? the GEB “Red Shields”, to wit:
And to tie it back to the opening graphics of manipulated temperatures, here’s where it slides into creepy territory. As unbelievable as it may sound, Rothschild acquired the world’s leading provider of weather graphics for TV, web, and mobile…
This is really important reading, as it connects many, MANY dots:
And here’s another from Pierre Gosselin’s NoTricksZone, a great weather site with lots of articles translated from German (and other languages) and some REALLY deep dive articles on weather, climate, and GoreBull Globalism, etc. from Kenneth Richard, among others)… https://notrickszone.com/2023/08/11/winter-cold-darkness-kill-while-summer-heat-and-sun-save-lives-data-clearly-show
Here’s a chart comparing heat vs. cold deaths from the folks who should know: the funeral homes and embalmers:
P.S. that (darkfutura at Simplicius) article I mentioned above has a dive into the origins of the weather madness that includes some familiar globalist names (Rothschilds, et. al.) and a lot of Gail’s posts have parallel data/infos. Seems the GoreBull-ists have been busy trying to bury it all, even more reason to have a look at it (and the wayback machine)…
Ep. 62 If fossil fuels come from fossils, why have scientists found them on one of Saturn’s moons? A lot of what you’ve heard about energy is false. Dr. Willie Soon explains.
TIMESTAMPS
(01:49) Fossil Fuels in Space (14:27) Global Warming Throughout History (25:31) Outside… pic.twitter.com/GMaDkDl8z9
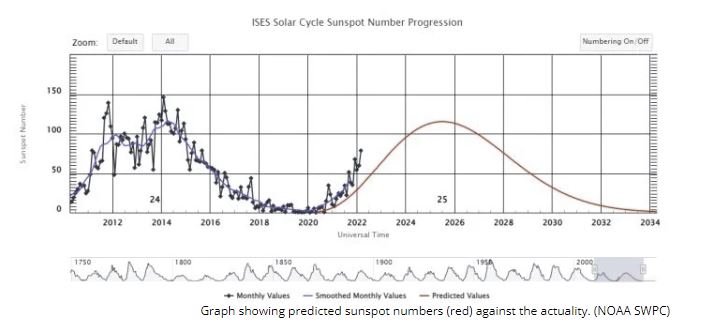
Starting January 2031, @NASA and @NOAA official sunspot prediction tables hit zero for the first time. The forecasted sunspot count prediction never comes back up. The forecast extends through 2040 and continues to decline in predicted total solar output from the Sun.
There will be decades of no sunspots starting in the 2030s. Why does that matter? It’s mostly a temperature thing, but there are other geophysical implications (volcanoes, earthquakes, increased effect of cosmic rays, increased cosmic strikes, etc). We can focus on the temperature and why that’s important.
The last time we experienced a 𝐺𝑆𝑀 was the Maunder Minimum (from 1645-1715) which happened during the Little Ice Age or the Mid Evil Ice Age (1300-1850). See the first chart. Global temperatures plummeted 1.5 degrees C. Life in Europe was already tough and it got tougher.
Changes in climate did not happen uniformly around the globe.
Cooling episodes in the Southern Hemisphere, such as in New Zealand and Patagonia, did not occur at the same time as cooling in the Northern Hemisphere. Some areas did not even experience cooling, such as eastern China. Europe experienced heavy rainfall while Africa and central and southern Asia experienced droughts. North America experienced both cooler temperatures and a drier period.
NASA predicts the Modern GSM could result in a 0.4 degree drop in global temperature. Other experts forecast as much a full 1 degree drop. The important part to understand is that it is going to start cooling soon. Everyone agrees.
The last winter like the one that is about to happen occurred 500 years ago. It should be important to note that not all times are the same times, but GSMs of the past have always preceded a global cooling period that has made previous times hard due to lack of access to food.
It’s a certainty that the Modern Grand Solar Minimum will coincide with global climate change. IMO, where the Modern GSM differs from those in the past is with regard to the Modern Magnetic Excursion – Earth’s magnetic state is already weakened. Some suggest as much as a 20% decline in strength. What are the implications there?
Just another rabbit hole to go down.
Sources
Miyahara, H., Tokanai, F., Moriya, T. et al. Gradual onset of the Maunder Minimum revealed by high-precision carbon-14 analyses. Sci Rep 11, 5482 (2021). https://doi.org/10.1038/s41598-021-84830-5…
Zharkova V. Modern Grand Solar Minimum will lead to terrestrial cooling. Temperature (Austin). 2020 Aug 4;7(3):217-222. doi: 10.1080/23328940.2020.1796243. PMID: 33117860; PMCID: PMC7575229.
If you want to know what the world’s top climate scientists think about the potential for and climate effects of a #GrandSolarMinimum, then you just need to ask.
I believe, given the data provided by @NASA on their website, that they are indeed quietly predicting a grand Solar minimum.
NASA (and friends) aren’t the only ones.
One of the world’s leading PhD in Astrophysics and Professor of Applied Mathematics with more than 200 papers on the Sun, Valentina Zharkova, published a paper in the esteemed Nature in 2015 that also, and independently, forecasts a Grand Solar Minimum.
Zharkova uses a different data set to measure the Sun’s activities which is so technical and complex that (after 15 hours of watching her lectures) I can understand it when it’s explained, but I wouldn’t be able to defend it against criticism on my own.
Lord only knows which climate scientist have read, watched, or learned anything in depth about solar activity and Earth’s climate. Most block me as soon as a present a deep level question.
This the response I got from a (or the) lead scientist at Berkeley Earth about the possibility of effects of a GSM.
He claims that NASA just left the table open through SC26 and the number reported are the tailings of the model that was used to predict SC25.
So NASA refutes the crazy idea of a GSM but leaves a table of bad data on the internet that supports it?
A table that coincides with Zharkova’s predictions, which they refute?
Man, the smartest guys in the world sure do some dumb shit.
To me this is troubling.
I will continue to seek input from both sides until I find the truth.
Note that he sent me a table of sunspot count. Zharkova’s entire position is that you can’t measure sunspots as predictive.
They are lagging indicators of the internal mechanics of the Sun’s activity.
Has a LOT of the “name names” in the opposition to the scam of “Global Warming”.
Presented in a very approachable manner. Has the real science in it, but in small bites, with context to “get it” without strain for those not inclined to spend years digging at it…
Ran into this on Rumble; it is likely elsewhere too (but was presented in the top list of “thumbnails” on Rumble 😉
Climate The Movie, The Cold Truth
Has a LOT of the “name names” in the opposition to the scam of “Global Warming”.
Presented in a very approachable manner. Has the real science in it, but in small bites, with context to “get it” without strain for those not inclined to spend years digging at it…
Assuming the above IPCC climate sensitivity estimate, the mean decadal increase of Earth’s sunlight absorption measured by CERES (Fig. 6) corresponds to a global surface warming of 0.797*0.47 = 0.37 K/decade, while the actual observed warming is only 0.23 K/decade
IPCC misrepresented the difference in measured radiation between short (Incoming solar radiation) and longwave (outgoing, effective. cooling radiation) for Earth opposite to what was actually observed.
When the proper measured data is used then the total claimed warming, supposedly due to Greenhouse gases, can be accounted for.
If I had to give a 30 second elevator speech to summarise what is at stake here, it would go something like this:
“The IPCC has turned upside-down the CERES data they are in denial of, in order to maintain the illusion that global warming has been caused by ‘heat trapping’ in the atmosphere due to the increase inCO2 levels.
“The opposite is true. The increase in Solar energy absobed by our planet more than accounts for all the warming, but the IPCC hasn’t calculated it, and avoids discussing it by misrepresenting the data which shows it.”


Yay!!! Relocated (retimed?)!!!
Wolfie did that for me last night.
What is weird is I reset the time to boot last night and it did automatically boot at the reset time BUT it kept the original date.
WordPiss hates me…
Yikes! Good thing the “science” is settled!
Wait until you see the rest of these articles. THEY ARE DAMNING! So do not miss them even if all you do is skim them.
The Rockefellers and their buddies embarked on a Psy-op to change the USA starting in the late 1800s and with used this 1970s cold spell to get the rest of the world leaders on board.
That is why this article is so important.
They used religious ties as a cover to meet their ends as well. But you already know that and I will stand down since I am anxiously awaiting your research.
Thank you!
👍
Oh Yeah! Pope Paul’s ousting was part of the whole thing as I just discovered yesterday.
They are ghouls, Well deserving of long, painful, tortuous deaths. My faith says to stay out of that, let God handle it as He instructs. But I am human and enraged.
This set of articles has been a real intellectual journey for me. I hope I make myself clear enough so others can follow my thoughts.
I think you’ve done an amazingly thorough job and that it is “clear enough” for those not well versed in these topics.
One thing that is clear is that those with an agenda do not care about science.
Nice work, Gail! I don’t understand all the science presented here, but I definitely get the drift of what is going on. Just want to let you know that the graphic isn’t showing in the section where you mention “Koppen climate boundaries for the US Midwest.” There is a great big white space there, even after several refreshes.
Try putting this in a different browser:[http://www.sturmsoft.com/climate/suckling_mitchell_2000_fig2_3.gif]
But take off the brackets at each end
Thanks, Gail. That worked.
Remember the close of an interglacial is a ‘Madhouse’
May 2019 — Australia to import wheat for first time in over a decade after the “Worst drought in 116 years”
06 Mar 2023 38 inches of snow in 24 hours wallops Soda Springs, California
07 Mar 2023 Eight dead, thousands displaced as flood ravages Zambian capital
07 Mar 2023 At least 15 killed in Indonesia landslide, dozens missing
08 Mar 2023 Ghana – Accra floods cause damage and fatalities
08 Mar 2023 Ecuador – Fatalities after floods and landslides in Manabí Province
I JUST HAD TO ADD THIS!
H/T TheseTruths
Cuppa Covfefe brought this great piece of evidence to the Qtree on
August 12, 2023 15:02
And from the darkfutura article I quoted above, guess who owns the weather graphics companies? the GEB “Red Shields”, to wit:
This is really important reading, as it connects many, MANY dots:
https://darkfutura.substack.com/p/climate-paranoia
And here’s another from Pierre Gosselin’s NoTricksZone, a great weather site with lots of articles translated from German (and other languages) and some REALLY deep dive articles on weather, climate, and GoreBull Globalism, etc. from Kenneth Richard, among others)…
https://notrickszone.com/2023/08/11/winter-cold-darkness-kill-while-summer-heat-and-sun-save-lives-data-clearly-show
Here’s a chart comparing heat vs. cold deaths from the folks who should know: the funeral homes and embalmers:
P.S. that (darkfutura at Simplicius) article I mentioned above has a dive into the origins of the weather madness that includes some familiar globalist names (Rothschilds, et. al.) and a lot of Gail’s posts have parallel data/infos. Seems the GoreBull-ists have been busy trying to bury it all, even more reason to have a look at it (and the wayback machine)…
https://twitter.com/TruthShepherrd/status/1701187344135512181
We are heading into the 𝑴𝒐𝒅𝒆𝒓𝒏 𝑮𝒓𝒂𝒏𝒅 𝑺𝒐𝒍𝒂𝒓 𝑴𝒊𝒏𝒊𝒎𝒖𝒎.
Don’t believe me. Believe NASA’s data. Believe peer-reviewed papers in Nature.
Starting January 2031, @NASA
and @NOAA
official sunspot prediction tables hit zero for the first time. The forecasted sunspot count prediction never comes back up. The forecast extends through 2040 and continues to decline in predicted total solar output from the Sun.
There will be decades of no sunspots starting in the 2030s. Why does that matter? It’s mostly a temperature thing, but there are other geophysical implications (volcanoes, earthquakes, increased effect of cosmic rays, increased cosmic strikes, etc). We can focus on the temperature and why that’s important.
The last time we experienced a 𝐺𝑆𝑀 was the Maunder Minimum (from 1645-1715) which happened during the Little Ice Age or the Mid Evil Ice Age (1300-1850). See the first chart. Global temperatures plummeted 1.5 degrees C. Life in Europe was already tough and it got tougher.
Changes in climate did not happen uniformly around the globe.
Cooling episodes in the Southern Hemisphere, such as in New Zealand and Patagonia, did not occur at the same time as cooling in the Northern Hemisphere. Some areas did not even experience cooling, such as eastern China. Europe experienced heavy rainfall while Africa and central and southern Asia experienced droughts. North America experienced both cooler temperatures and a drier period.
NASA predicts the Modern GSM could result in a 0.4 degree drop in global temperature. Other experts forecast as much a full 1 degree drop. The important part to understand is that it is going to start cooling soon. Everyone agrees.
The last winter like the one that is about to happen occurred
500 years ago. It should be important to note that not all times are the same times, but GSMs of the past have always preceded a global cooling period that has made previous times hard due to lack of access to food.
It’s a certainty that the Modern Grand Solar Minimum will coincide with global climate change. IMO, where the Modern GSM differs from those in the past is with regard to the Modern Magnetic Excursion – Earth’s magnetic state is already weakened. Some suggest as much as a 20% decline in strength. What are the implications there?
Just another rabbit hole to go down.
Sources
Miyahara, H., Tokanai, F., Moriya, T. et al. Gradual onset of the Maunder Minimum revealed by high-precision carbon-14 analyses. Sci Rep 11, 5482 (2021). https://doi.org/10.1038/s41598-021-84830-5…
The effects of the Little Ice Age (c. 1300-1850). Climate in Arts and History. (2021, June 30). https://science.smith.edu/climatelit/the-effects-of-the-little-ice-age/#:~:text=The%20Little%20Ice%20Age%20was,in%20Europe%20and%20North%20America….
NASA and NOAA sunspot prediction. https://swpc.noaa.gov/products/predicted-sunspot-number-and-radio-flux…
Zharkova V. Modern Grand Solar Minimum will lead to terrestrial cooling. Temperature (Austin). 2020 Aug 4;7(3):217-222. doi: 10.1080/23328940.2020.1796243. PMID: 33117860; PMCID: PMC7575229.
https://nitter.net/TruthShepherrd/status/1701187344135512181#m
If you want to know what the world’s top climate scientists think about the potential for and climate effects of a #GrandSolarMinimum, then you just need to ask.
I believe, given the data provided by @NASA
on their website, that they are indeed quietly predicting a grand Solar minimum.
NASA (and friends) aren’t the only ones.
One of the world’s leading PhD in Astrophysics and Professor of Applied Mathematics with more than 200 papers on the Sun, Valentina Zharkova, published a paper in the esteemed Nature in 2015 that also, and independently, forecasts a Grand Solar Minimum.
Zharkova uses a different data set to measure the Sun’s activities which is so technical and complex that (after 15 hours of watching her lectures) I can understand it when it’s explained, but I wouldn’t be able to defend it against criticism on my own.
Lord only knows which climate scientist have read, watched, or learned anything in depth about solar activity and Earth’s climate. Most block me as soon as a present a deep level question.
This the response I got from a (or the) lead scientist at Berkeley Earth about the possibility of effects of a GSM.
He claims that NASA just left the table open through SC26 and the number reported are the tailings of the model that was used to predict SC25.
So NASA refutes the crazy idea of a GSM but leaves a table of bad data on the internet that supports it?
A table that coincides with Zharkova’s predictions, which they refute?
Man, the smartest guys in the world sure do some dumb shit.
To me this is troubling.
I will continue to seek input from both sides until I find the truth.
Note that he sent me a table of sunspot count. Zharkova’s entire position is that you can’t measure sunspots as predictive.
They are lagging indicators of the internal mechanics of the Sun’s activity.
https://pbs.twimg.com/media/F7Cq7SUXsAEnUEk?format=jpg
Solar up date as of Jan 2024
https://wattsupwiththat.com/2024/01/29/solar-update-january-2024/
Chiefio. After posting, off to watching the movie… (Oops. 1:19:53. Not gonna watch it all tonight.)
A Very Good: “Climate The Movie”
Ran into this on Rumble; it is likely elsewhere too (but was presented in the top list of “thumbnails” on Rumble
https://s.w.org/images/core/emoji/15.0.3/svg/1f609.svg
Climate The Movie, The Cold Truth
Has a LOT of the “name names” in the opposition to the scam of “Global Warming”.
Presented in a very approachable manner. Has the real science in it, but in small bites, with context to “get it” without strain for those not inclined to spend years digging at it…
https://rumble.com/v4vpbwt-climate-the-movie-the-cold-truth-multi-lingual-closed-captions.html
https://chiefio.wordpress.com/
kalbokalbs
May 18, 2024 21:23
Chiefio. After posting, off to watching the movie… (Oops. 1:19:53. Not gonna watch it all tonight.)
A Very Good: “Climate The Movie”
Ran into this on Rumble; it is likely elsewhere too (but was presented in the top list of “thumbnails” on Rumble 😉
Climate The Movie, The Cold Truth
Has a LOT of the “name names” in the opposition to the scam of “Global Warming”.
Presented in a very approachable manner. Has the real science in it, but in small bites, with context to “get it” without strain for those not inclined to spend years digging at it…
https://rumble.com/v4vpbwt-climate-the-movie-the-cold-truth-multi-lingual-closed-captions.html
https://chiefio.wordpress.com/
THE DAILY CHART: RECORD HEAT, THEN AND NOW — Powerline blog

eilert ( eilert)Offline
July 26, 2024 08:40
#1312203
Nikolov & Zeller: Misrepresentation of Critical Satellite Data by IPCC | Tallbloke’s Talkshop (wordpress.com)
IPCC misrepresented the difference in measured radiation between short (Incoming solar radiation) and longwave (outgoing, effective. cooling radiation) for Earth opposite to what was actually observed.
When the proper measured data is used then the total claimed warming, supposedly due to Greenhouse gases, can be accounted for.
Elevator speech from Tallbloke in the comments