
What is it that feeds our battle, yet starves our victory?
January 6 Tapes?
Where are the tapes? Anyone, Anyone? Bueller? Johnson??
Paging Speaker Johnson…this is your conscience calling you out on broken promises.
Evading Reality
Many things the Left believes are simply not true. Right now the focus is on the size and scope of our government, and the many many billions of dollars the government has been spending on no-one-knew-what. None of that money is going to a key role of government. Which, after all, has the sole purpose of protecting rights.
And if you, Leftist Lurker, want to dismiss this as dead white cis-male logic…well, you can call it what you want, but then please just go fuck off. No one here buys that bullshit–logic is logic and facts are facts regardless of skin color–and if you gave it a moment’s rational thought, you wouldn’t either. Of course your worthless education never included being able to actually reason–or detect problems with false reasoning–so I don’t imagine you’ll actually wake up as opposed to being woke.
As Ayn Rand would sometimes point out: Yes, you are free to evade reality. What you cannot do is evade the consequences of evading reality. Or to put it concretely: You can ignore the Mack truck bearing down on you as you play in the middle of the street, you won’t be able to ignore the consequences of ignoring the Mack truck.
And Ayn Rand also pointed out that existence (i.e., the sum total of everything that exists) precedes consciousness–our consciousnesses are a part of existence, not outside of it–therefore reality cannot be a “social construct” as so many of you fucked-up-in-the-head people seem to think.
So much for Leftist douchebag lurkers. For the rest of you, the regular readers and those lurkers who understand such things, well here we go for another week of WINNING against the Deep State.
I confess that the novelty has not worn off.
Justice Must Be Done.
The prior election must be acknowledged as fraudulent, and steps must be taken to prosecute the fraudsters and restore integrity to the system.
Yes, we won this time around. Not only did we win, we got to KEEP that win instead of having it stolen from us.
But no one should imagine that that’s the end of electoral fraud. Much work needs to be done to ensure it doesn’t just happen again next time around. And incidentally to rescue those states currently in the grips of self-perpetuating fraud, where the people who stole the last election, make sure it’s easier to steal the next one.
This issue, though it’s not front-and-center right now, is not going away, and if we ignore it, we’ll pay the price. See the article above about the consequences of evading reality.
Lawyer Appeasement Section
OK now for the fine print.
This is the WQTH Daily Thread. You know the drill. There’s no Poltical correctness, but civility is a requirement. There are Important Guidelines, here, with an addendum on 20191110.
We have a new board – called The U Tree – where people can take each other to the woodshed without fear of censorship or moderation.
And remember Wheatie’s Rules:
1. No food fights
2. No running with scissors.
3. If you bring snacks, bring enough for everyone.
4. Zeroth rule of gun safety: Don’t let the government get your guns.
5. Rule one of gun safety: The gun is always loaded.
5a. If you actually want the gun to be loaded, like because you’re checking out a bump in the night, then it’s empty.
6. Rule two of gun safety: Never point the gun at anything you’re not willing to destroy.
7. Rule three: Keep your finger off the trigger until ready to fire.
8. Rule the fourth: Be sure of your target and what is behind it.
(Hmm a few extras seem to have crept in.)
Spot Prices.
Kitco Ask. Last week:
Gold $3,329.00
Silver $32.65
Platinum $976.00
Palladium $984.00
Rhodium $5,750.00
FRNSI* 160.040+
Gold:Silver 101.960+
This week, markets closed as of 3PM MT.
Gold $3,320.30
Silver $33.17
Platinum $982.00
Palladium $970.00
Rhodium $5,825.00
FRNSI* 159.620-
Gold:Silver 100.099+
Gold went on QUITE a ride this week!. It came within a loud shout of $3500 but then plummeted, dropping all the way into the 3200s, and ended up almost where it began. Silver didn’t drop as hard, and Gold:Silver dropped below 100, but again it seems almost as if silver really wants to be right there at 1/100th of an ounce of gold.
*The SteveInCO Federal Reserve Note Suckage Index (FRNSI) is a measure of how much the dollar has inflated. It’s the ratio of the current price of gold, to the number of dollars an ounce of fine gold made up when the dollar was defined as 25.8 grains of 0.900 gold. That worked out to an ounce being $20.67+71/387 of a cent. (Note gold wasn’t worth this much back then, thus much gold was $20.67 71/387ths. It’s a subtle distinction. One ounce of gold wasn’t worth $20.67 back then, it was $20.67.) Once this ratio is computed, 1 is subtracted from it so that the number is zero when the dollar is at its proper value, indicating zero suckage.
Carbon Dating
Carbon dating is when you date identical twins, one of whom is a carbon copy of the other. Generally available only to people as cool as the Fonz (who IIRC dated triplets at one point). Alternatively it is defined as dating having reached the point where a diamond is involved, possibly because uranium-lead dating or potassium-argon dating got out of hand.
OK, more seriously…it involves the isotope 14C or carbon-14 or C-14, depending on who’s writing the stuff you’re reading and how lazy they are. I’m lazy enough not to bother with the first, most technically correct, notation.
Carbon dating is generally not relevant to geologists, but is very relevant to archaeologists, who dig up human remains and/or human artifacts. Why? Timescale. The half life of carbon-14 is 5700 years (give or take 30 years). This makes it worthless for geological time; they generally don’t want to push it past 50,000 years. But it’s eminently suitable for modern humans and gets us well back into the prior ice age which ended roughly 12,000 years ago.
Even though this is supposed to be a geology series, I decided to cover carbon dating anyway because it has a number of features that make it a contrast to the other methods used. And also hopefully to immunize my readers against the next earnest-sounding ignoramus who complains about carbon-dating the age of the Earth.
Carbon, element 6, has two stable isotopes, carbon-12 (6 protons, six neutrons), and carbon-13 (6 protons, 7 neutrons). And then there is carbon-14, with six protons and eight neutrons. As noted above, it’s unstable with a half life of 5700 years (give or take 30 years). It undergoes regular ol’ beta decay and turns into an atom of nitrogen-14, which is quite stable.
Carbon dating is sometimes conflated with radiometric dating in general, especially by the general public. They talk about dating rocks, or determining the age of the Earth, with carbon dating, oftentimes with a sneer because they don’t believe the result. Ironically, they’d be right to do so if we actually tried to use carbon dating for these purposes. (It’s much more hilarious when a professional young earth creationist makes this particular blunder.) Carbon dating is radiometric dating, but not all radiometric dating is carbon dating.
Carbon-14 is not used to date rocks, it’s used to determine when something organic died. Living things ingest carbon-14 with their carbon dioxide, food, you-name it, when they die, they no longer bring carbon-14 in and the radiometric clock starts ticking.
For a number of reasons, carbon dating is the oddball method of all the ones I’ve discussed, because it does not depend on a primordial isotope. Uranium-235 and -238, thorium-232, rubidium-87, potassium-40 are all primordial isotopes, meaning what we see out there today was “with us” when the Earth formed.
Obviously this won’t be true for carbon-14; the Earth is way too old for that. So carbon-14 must be getting created today.
(Indeed, the mere fact that no short lived isotopes are around any more except in cases where we can demonstrate they are being created now, is evidence that the Earth is quite old. The shortest lived primordial (non-renewed) radioisotope is U-235 with its 704 million year half life. In general after about 40 half lives the radioisotope is effectively gone; roughly one atom in a trillion is still around. The next longest half life of any radioisotope after U-235 is samarium-146 at 92 million years. [That’s quite a gap! It’s surprising nothing other than U-235 has half lives in the hundreds of millions of years.] And sure enough 40 half lives of that is 3,680 million years…so it would be essentially gone after that amount of time. And guess what. It is in fact all gone [actually traces should still be around, we haven’t detected them yet], as one would expect if and only if the Earth is old.)
Most carbon-14 is generated by cosmic rays plowing through our upper atmosphere. This creates free neutrons, some of which will glom onto nitrogen-14 atoms, and kick out one of the protons; this replacement of a proton with a neutron is as if the C-14 to N-14 beta decay is run in reverse. This apparently happens (depending on who is doing the calculation) 16,400 or 18,800 times per second per square meter of the Earth’s surface, all at altitudes between 9 and 14 km. (As you can imagine this is tough to measure under those circumstances; hence the approximate calculations that do match what we observe later on in the process.)
The nitrogen (N2) molecule becomes a CN radical and eventually the C-14 atom ends up in carbon dioxide, where it can be sucked in by plants. Once incorporated in the plant tissue it can make its way through the entire food chain as some animal eats the plant, some other animal eats the first animal, and so on. Every living thing is constantly pulling carbon-14 into its system, replacing any that happens to decay while it’s living. When it dies, this process ends and decaying C-14 is no longer replaced. We now have something we can radiometrically date, just as we can date rocks once they solidify.
In this particular case they take their sample and count carbon-12, carbon-13, and carbon-14 atoms, and compare the ratios to what we see in atmospheric CO2 today. After doing the same sorts of calculations I’ve highlighted in previous posts, they get a date which is reported as “Before Present.” That has become a bit of a misnomer, now, because “Present” was 1950, and 75 years have since elapsed.
And therein lies the need for an asterisk. As it turns out the C-14 to C-12 ratio in our atmosphere is not constant. Not only is it not constant over time, it’s not constant over location either. Even today we can measure it’s lower near cities than out in the middle of nowhere; that’s due to the extra CO2 emissions near cities. Fossil fuels have essentially no C-14 in them, so when they burn they add purely to the amounts of C-12 and C-13, which pushes the ratio down. Time variation can be caused by anything from solar flares, other variations in cosmic ray flux, and even nuclear tests which tend to dump large numbers of neutrons, giving a big boost to C-14 production.
What effect does this have on carbon dating? Let me illustrate with an example, a made-up one. Let’s say that (for whatever reason) 43,000 years ago the C-14:C-12 ratio in the atmosphere was twice as high as it is today. At that time a Neanderthal grabs a piece of deadfall and takes it to his cave to build a fire, but for whatever reason it doesn’t end up being burned.
Today, an archaeologist finds that piece of unburned wood right next to a bunch of cave paintings, and decides he wants to know how old that Neanderthal dwelling is. So he sends it off to the lab to get it dated. What he doesn’t know is that when the tree grew, the C-14:C-12 ratio in the atmosphere was twice as high as it is today. 43,000 years is about 7 1/2 half lives of C-14; after each half life has elapsed, the C-14 count is still twice as high at that age as it would have been if the wood had started with today’s amount of C-14 in it.
So as far as the lab can tell, 6 1/2, not 7 1/2, half lives have elapsed since the sample was formed (because they don’t know the sample started out a half-life “behind”), so they send back: 37,300 (43,000 – 5,700) years old.
That’s quite a difference!
Scientists realized this was a potential issue at least as far back as 1955–in fact the first to point it out was Willard Lilly, who invented radio carbon dating! And it became an absolute certainty when samples of known ages started coming back with variant ages. So they started working on ways to calibrate carbon dating.
The unadjusted age number is now called radiocarbon years. That’s the “flag” to warn the reader that the date is not calibrated. In our example, the firewood came back as being 37,300 radiocarbon years old, even though we (with our god’s eye view) know it’s really 43,000 years old.
What is needed is a way to look up a figure given in radiocarbon years, and read off the corrected age. In our example, the archaeologist (or perhaps the lab that did the work) would look up in the right table (it turns out we need different tables for marine and land, and northern and southern hemisphere) “37,300” radiocarbon years and read off “43,000” calendar years.
So how do we make such a table? By radiocarbon-dating samples of known age, and seeing what the results return.
Of course, these are scientists. Why would they use a table when they can make a graph? Here’s an actual graph.
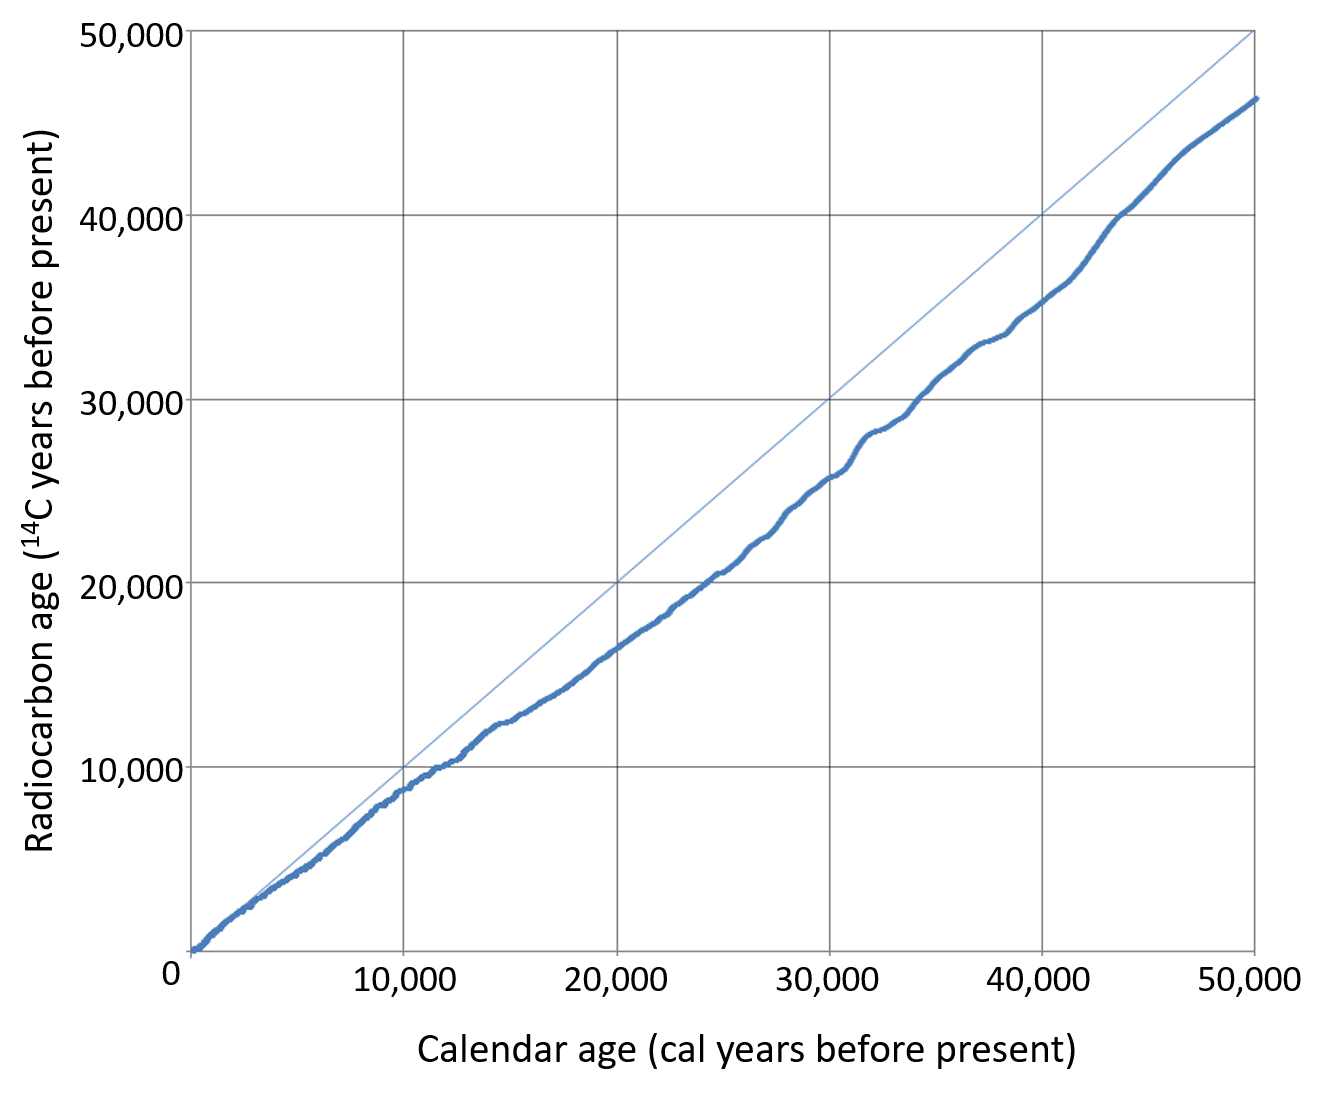
In actual fact, I chose that 43,000 number for the example fairly carefully. If you look up 43,000 on the horizontal axis (the true, calendar ages) and read up you hit one of the spots where the blue crooked line is furthest from the diagonal line where the calendar age would equal the radiocarbon age [no correction needed]. It’s almost, but not quite, off by a half life. So my example wasn’t all that exaggerated.
A graph is also handy because of another potential problem. If you look really closely where the squiggly line crosses 10,000 cal years…that bit of the line looks flat. What that means a bunch of numbers close to 10,000 cal years all have the same radiocarbon age. In fact looking at about 14,000 cal years, there’s almost a thousand year long stretch with nearly the same radiocarbon age.
So because of the variation, sometimes the age will come back ambiguous.
This is actually much more of a problem for recent times.
Consider the fact that these numbers always come out with a margin of error, e.g., +/- 80 radiocarbon years.
Here’s the calibration curve for things that date 1000-1400 radiocarbon years.
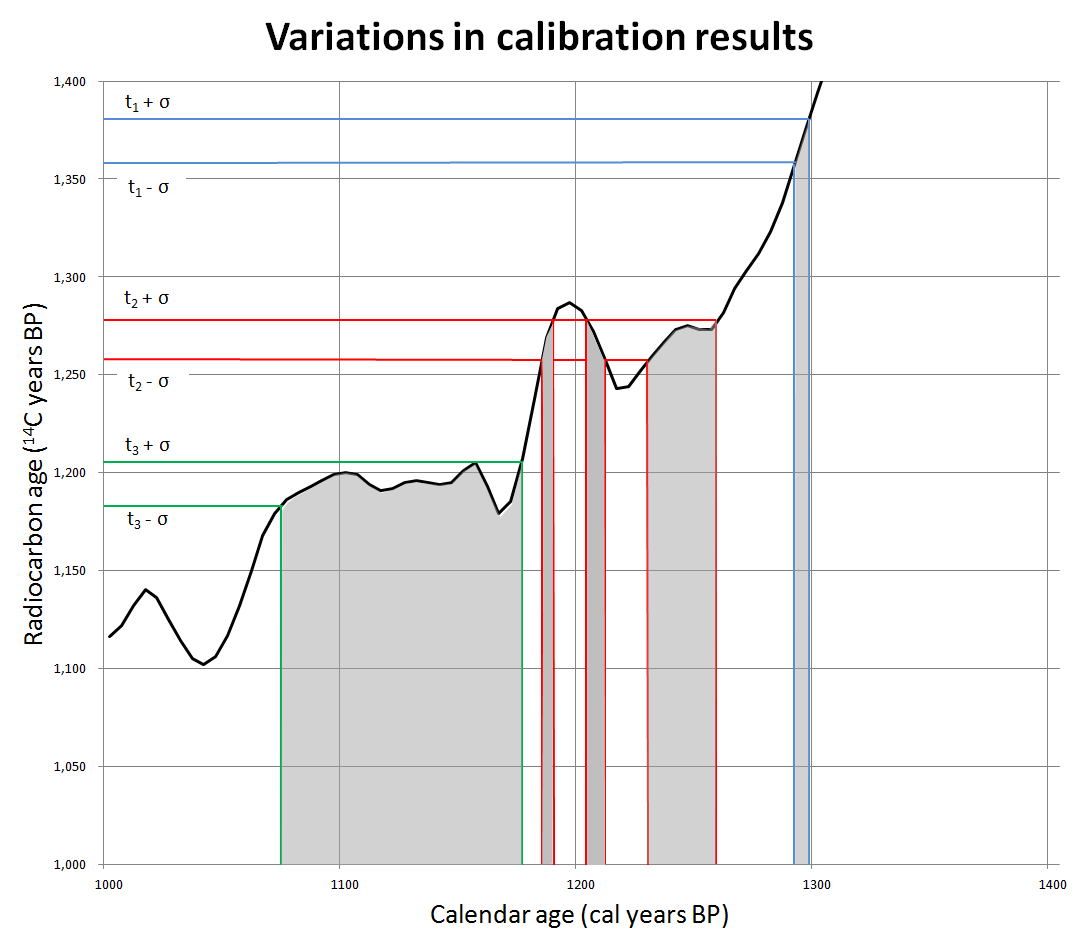
Looking over at the left, sample one returned (eyeballing it), a range of 1360-1380 radiocarbon years (blue lines). Reading across, we find a place where the calibration curve is steep, so we end up with a very narrow, 10 year calendar range, 1290-1300 years BP, which is to say 650-660 CE. Steep is good!
It’s shallow that can be a bit of a disaster. Look at sample two, 1260 to 1280 radiocarbon years (red lines), just one century newer in radiocarbon terms than sample 1.
But here the curve zigzags across our range! There are therefore three distinct age ranges that our sample could actually date from, roughly 1185-1190 years BP, 1205-1215 years BP, and 1230-1260 years BP. A 55 year spread, with gaps in it.
The third sample is maybe better, maybe worse depending on how you look at it. No gaps but an even bigger spread. Radiocarbon age is 1180-1205 BP, but because here the curve is very shallow, basically horizontal with ups and downs, the calendar age is is 1075-1175 years BP–a full century of uncertainty.
And even this method (which is called the “intercept” method is now out of date, there are much more complex probabilistic methods that require computing power, which we now have readily available. Here’s Wikipedia on the subject of radiocarbon calibration: https://en.wikipedia.org/wiki/Radiocarbon_calibration
Ambiguity can be combated by working on ways to have the lab be more accurate but note that in case 2 even if we had the radiocarbon age to an exact number of years, we’d still have three answers.
OK, I showed curves, but how did we come up with those curves?
As it happens we have plenty of other ways to date some artifacts that can also be radiocarbon dated, enough that we can fill in a lot of the table (or plot points on the graph). This of course is very tedious work and whoever does it won’t get a Nobel prize, but they are unsung heroes of archaeology. It is thanks to them that we can have great confidence in our data, in most cases (and know when we shouldn’t, as in the case of the poor guys who had samples 2 and 3 in the graph above).
What are some of those ways of determining absolute ages? Actually the first attempts to do this were from Egyptology. Because ancient Egyptian records sometimes reference astronomical events happening during such-and-such reign, we know when that reign happened–because we can calculate when the astronomical event happened (good ol’ astrodynamics…). If we have papyrus from that time, we can see how old it is in radiocarbon years. This has since been extended to other civilizations.
But the most famous means used (though by no means the only one) is a product of nature: dendrochronology, which is, in essence, counting and matching up tree rings. As trees grow they leave annual rings in the wood grain. (They’re rings going across the log, otherwise, running the length of the log, they have the sort of “woodgrain” pattern you see in lumber of any kind.) In fact, this pattern will tend to have thicker and thinner rings depending on whether the tree got a lot of water or less water that particular season; more growth equals a thicker ring. Different trees from the same region will show the same pattern of thick and thin rings for the same years. And it’s even possible to match up the pattern in old pieces of wood to the corresponding years in either a) newer pieces of wood or b) trees growing today. We’ve managed to construct at least one sequence that goes back 13,900 actual years BP (i.e., 13,975 years before today).
The oldest tree-ring series are known as floating since, while their constituent rings can be counted to create a relative internal chronology, they cannot be dendro-matched with the main Holocene absolute chronology. However, 14C analyses performed at high resolution on overlapped absolute and floating tree-rings series enable one to link them almost absolutely and hence to extend the calibration on annual tree rings until ≈13 900 cal yr BP.
Bard, Edouard, et. al, 9 October 2023 as quoted in Wikipedia. (Philosophical Transactions A. 381 (2261). Bibcode:2023RSPTA.38120206B. doi:10.1098/rsta.2022.0206. PMC 10586540. PMID 37807686)
In this case we can simply date the wood taking samples from (say) every tenth or hundredth ring. We know the actual age from simple counting of the rings; we can fill in the entries of the calibration table based on the uncalibrated results the lab returns to us. We can supplement this from atmospheric gases trapped in ice cores (which also have annual layers) and organic debris in varves (layers of sediment).
And this is why I left carbon dating for last. The other sorts of dating don’t need calibration, not because ratios were constant but because we have ways of accounting for variation, built into the method. With radio carbon dating we don’t have that luxury, at least not purely by analyzing the sample, so we have to calibrate. Luckily at the short (by geological standards) timescales radio carbon dating covers we have other means of correcting what we get.
As I said before, carbon dating won’t help geologists date things in the geologic column (at least not before the very topmost thin layer), but I felt I had to cover it because it gets confused with the other forms of radiometric dating. It also has the additional complication of needing calibration; someone might get the impression from this that the other methods have the very same issue. They don’t.
(And of course if you run into someone complaining about “carbon dating” dinosaur fossils, he literally doesn’t know what he’s talking about; he’s hopefully misremembering something he heard from someone else, or [less hopefully] the someone else he’s remembering is himself clueless…or a charlatan. The good news is most of the well-funded young-Earth creationist organizations today do know better than to make this particular blunder.)
One last point to make: There are Young Earth Creationist talking points about finding radiocarbon in diamonds (up to billions of years old) or in carbon in fossils of dinosaurs (66-235 Mya). If these held up of course that would be serious trouble for old earth viewpoints, but the problem here is that there’s every sign that they’re measuring contamination. Samples are sent to multiple labs all around the world, and the reported ages are a) not far below the upper limit of C-14 dating and b) wildly different from each other, by at least a half life. Whereas what we see with properly collected samples is consistent ages. (More about this in the second video below at about 13:30.)
Bonus Videos
Here is a video by Aron Ra (as far as I can tell that’s his legal name), talking to an actual scientist (Dr. Jonathan Baker) while said scientist runs a rock sample in the lab, measuring uranium and thorium isotopes–he’s actually using a method different from any I covered, one suitable for ages less than a million years. Aron Ra is famous in atheist circles for combating creationism (all types not just Young Earth) so he does kid the scientist about his data popping out with 6000 years. Between the two of them they make the point that there are literally hundreds of studies that return consistent results.
There are some fundamental differences between this method and other methods, having to do with the fact that the daughter isotope is even more radioactive than the parent (and the parent is water soluble while the daughter is not, so it’s used for dating stalactites), but I am sure you don’t want another Saturday open devoted to that topic, so I’ll punt you over to this: https://en.wikipedia.org/wiki/Uranium%E2%80%93thorium_dating
A more general video by the same two people. Aron Ra got hit by a troll who threw a bunch of AIG talking points; he has Dr. Baker respond, and the responses are educational (not simply anti-YEC polemics). A lot of info on carbon dating here starting about 13:30 in.
Quotable line: “They do seem fascinated with carbon dating, it’s like they’re not even aware that there’s like well over a dozen, maybe a dozen and a half other radioisotopes that they would be using for dinosaurs, that they don’t use carbon dating for dinosaurs, and why they don’t. I don’t know why they insist on doing that.” Hence this “intruder” topic into a geology series.
Another line: the troll asks “Do you know that forest fires, atomic activity, volcanic eruptions, factories that produce carbon, solar flares, carbon reservoirs, contribute to the inconsistent decay rate and contamination that results to the inaccuracies in carbon dating?” and Dr. Baker responds…”uh, yes, I did know that.” But we know how to take these things into account and can often cross-check with other methods of dating (which is what he was doing in the first video).
And from Dr. Baker’s channel (Age of Rocks):
Ted Talk by a paleontologist about hunting for dinosaurs, he talks a lot about geology here (interestingly that diagram behind him in the thumbnail also appears in the prior video; I guess it’s a pretty popular graphic). Please excuse the “sixth mass extinction” stuff at the very end. (Well, at least he didn’t say “global warming.”)