My thesis here is that the Cabal learned, in the late 1960s, early 1970s, that the earth was likely heading into an ice age. I documented this in GREENHOUSE, ICEHOUSE OR CLIMATIC MADHOUSE? h/t Neuman and Hearty (1996) They decided to hide that fact from the general population while preparing for glaciation by consolidating power, conserving resources and reducing world population growth. Via grant money they also directed research into genetic manipulation of plants and animals, surveillance techniques and other technology. They knew that over the last 5 to 8 million years during glaciation, CO2 dipped dangerously low, forcing the evolution of C4 plants and the extinction of mammals. This explains many of their disinformation campaigns such as ‘Global Warming, CO2 is BAD, Feminism, abortion is good, and having too many kids is BAD. It even explains the nuclear power scares. They are well aware that the Grand Solar Maximum that lifted the earth out of the Little Ice Age has now ended, and they may truly think that a new Ice Age is imminent.
2011- Russian scientist predicts 100 years of cooling
Updated November 11, 2016 – Top Russian Scientist Claims -The Next ‘Little Ice Age’ Is Already Here
No one wants to stick their neck out and predict glaciation, but it does not matter. The only choices are glaciation or a climatic ‘madhouse.’ Either way the only climate we will see in the near future is the ‘madhouse.’
Before I get into the evidence showing why the Cabal wants to conserve coal, oil and nuclear fuels for use during the coming cooling/ice age, I want to point out another indicator that the Cabal is expecting the transition to glacial conditions AND THEY EXPECT IT NOW. Since William McClenney wrote Glacial Inception: the climatic ‘madhouse’ nine years ago, his link to the Neuman & Hearty paper has gone dead … Imagine that!!! Since I started to write this paper even more ‘clean-up’ of ‘inconvenient’ information has occurred so I am going to address that as a separate topic.
CLIMATIC MADHOUSE
I would also like to point out the recent change in the Cabal’s rhetoric. The talking heads no longer use ‘Global Warming,’ since it is no longer warming, and instead use ‘Climate Change’ or ‘Climate Disruption’. Hearty uses the phrase ‘Climatic Madhouse’ for the same phenomena. That is certainly a good reason for the Cabal to deep six the paper referenced by McClenney at WUWT. They do not want a reference pointing out that ‘Climate Disruption’ is not only natural, but an indication that we are heading into either Little Ice Age conditions or a full blown Ice Age.
William McClenney @ WUWT May 31, 2014 1:38 pm
…“This has prompted the remark that between the greenhouse and the icehouse lies a climatic “madhouse”, which was stated by Neuman and Hearty (1996) http://www.researchgate.net/publication/249518169_Rapid_sea-level_changes_at_the_close_of_the_last_interglacial_(substage_5e)_recorded_in_Bahamian_island_geology/file/9c96051c6e66749912.pdf
That is the dead link I will be addressing later.
Here is another similar paper by Neuman & Hearty from December 2001
Rapid sea level and climate change at the close of the Last Interglaciation (MIS 5e): Evidence from the Bahama Islands
The geology of the Last Interglaciation (sensu stricto, marine isotope substage (MIS) 5e) in the Bahamas records the nature of sea level and climate change. After a period of quasi-stability for most of the interglaciation, during which reefs grew to +2.5 m, sea level rose rapidly at the end of the period, incising notches in older limestone. After brief stillstands at +6 and perhaps +8.5 m, sea level fell with apparent speed to the MIS 5d lowstand and much cooler climatic conditions. It was during this regression from the MIS 5e highstand that the North Atlantic suffered an oceanographic “reorganization” about 118±3 ka ago. During this same interval, massive dune-building greatly enlarged the Bahama Islands. Giant waves reshaped exposed lowlands into chevron-shaped beach ridges, ran up on older coastal ridges, and also broke off and threw megaboulders onto and over 20 m-high cliffs. The oolitic rocks recording these features yield concordant whole-rock amino acid ratios across the archipelago. Whether or not the Last Interglaciation serves as an appropriate analog for our “greenhouse” world, it nonetheless reveals the intricate details of climatic transitions between warm interglaciations and near glacial conditions.
And a paper by different authors looking at a different part of the world showing a similar chaotic transition from the warm phase to the cold phase.
Instability of climate and vegetation dynamics in Central and Eastern Europe during the final stage of the Last Interglacial and Early Glaciation
This is a review of several different studies. The scientists are looking at both the geochemical data and the biological data (pollen), two independent methods of determining the climate of the past showing the same chaos.
1. INTRODUCTION
The time intervals of global large-scale transitions between glacial and interglacial epochs are characterized by instable stages throughout Quaternary climate course. During such warm-cold transitions an increase of mid- and small-scale climate variations can be expected….
At the very end of the Eemian (PAZ E7) and just before the complete change to glacial conditions, a brief phase of warming is recognized from all geochemical indicators. This is indicated by the coordinate increase of contents and stable isotope values of both lake carbonate and the organic sediment fraction…
…Comparable findings were also described by earlier investigations of the Neumark–Nord profile (Litt, 1994). A pronounced increase of fluctuations in arboreal vegetation during the final stage of the Last Interglacial in LPAZ N8 is observed…. at least two stages of degradation of coniferous forest vegetation, while birch woodlands became widespread. Together with geochemical data, these can be interpreted as an indicator of increased climatic instability caused by short warming events during the very end of the Last Interglacial (Eemian)….
The earth’s climate seems to be bistable so that a temperature ‘low point’ has “increased climatic instability” as seen during the Little Ice Age. So whether we are looking at the very end of the Holocene and Glacial inception OR the earth bumping along at the low point with “cooling over the next ~90,000 years.” – Dr.Lorraine Lisiecki, April 6, 2010 at 7:31 pm the chances are the earth will be experiencing increasingly unstable weather and the Cabal, darn well KNOWS THAT. Hence the new term ‘Climate Disruption’.
WHAT ARE THE CHARACTERISTIC WE CAN EXPECT OF A COMING ICE AGE?
‘Arid, Windy, Dusty’ from lack of rain plus much lower CO2. Combine that with a shorter cooler summer growing season and you are looking at starvation, UNLESS you have greenhouses with Heat, CO2 and desalinated water. Under those conditions, coal, oil, gas and nuclear are priceless resources.
Köppen Climate Classification: Defining The Climate Zones Of The World
….The close correlation between climate and vegetation is evident in every part of the world. (The cold, dry conditions of Antarctica and the moist & humid conditions of the tropical rain forests in South America are just two examples of this powerful interaction.) The strong connection between the two is also proving to play a key role in categorizing and dividing the global climate into more specific zones….
Late in the 19th century, climatologist and botanist Wladimir Köppen developed a climate classification system based on vegetation. He used the correlation between vegetation and climate in different regions to divide the world’s climate into specific zones….
Climatologists continued to make amendments to Köppen’s climate classification. Rudolf Geiger was probably the most influential in making important amendments, and the subsequent Köppen-Geiger Classification System is one of the most widely used today….
The following graphs shows the Köppen Climate Boundary for mid America. If you look at the bottom graph, you can see how the cooling in the 1970s moved the Köppen Climate Boundary south by about 150 to 200 miles. Think what that did to the grain harvests in not only the USA, but also in Canada, Russia and China. World leaders were panicking as world grain stores were depleted to a 30 day supply by1969 per 1974 CIA Report mentioned below.

This is the December 3, 1972 Letter from George Kukla and others warning Nixon of a coming Ice Age. I originally saw this letter at Tony Heller’s site. Between the time I started writing and now it was removed. However I found another copy.
An important letter sent to the President about the danger of climate change
An important conference was held in January at Brown University: “The Present Interglacial, How and When Will it End?” As a result, the following letter was sent to the President. The media has not reported this, but you should be aware of the letter and its significance.
Dear Mr. President:
Aware of your deep concern with the future of the world, we feel obliged to inform you on the results of the scientific conference held here recently. The conference dealt with the past and future changes of climate and was attended by 42 top American and European investigators. We enclose the summary report published in Science and further publications are forthcoming in Quaternary Research.
The main conclusion of the meeting was that a global deterioration of climate, by order of magnitude larger than any hitherto experience by civilized mankind, is a very real possibility and indeed may be due very soon.
The cooling has natural cause and falls within the rank of processes which produced the last ice age. This is a surprising result based largely on recent studies of deep sea sediments.
Existing data still do not allow forecast of the precise timing of the predicted development, nor the assessment of the man’s interference with the natural trends. It could not be excluded however that the cooling now under way in the Northern Hemisphere is the start of the expected shift. The present rate of the cooling seems fast enough to bring glacial temperatures in about a century, if continuing at the present pace.
The practical consequences which might be brough by such developments to existing social institution are among others:
(1) Substantially lowered food production due to the shorter growing seasons and changed rain distribution in the main grain producing belts of the world, with Eastern Europe and Central Asia to be first affected.
(2) Increased frequency and amplitude of extreme weather anomalies such as those bringing floods, snowstorms, killing frosts, etc.
With the efficient help of the world leaders, the research …
With best regards,
George J. Kukla (Lamont-Doherty Geological Observatory)
R. K. Matthews (Chairman, Dept of Geological Sciences, Brown U)
And a 1974 article by the Guardian. Again, H/T Tony Heller. Funny, this one was not deep-sixed like the above image.

The Malthusian Eugenicists like John D Rockefeller seized on this coming Ice Age information to further scare world leaders into going along with their Depopulation plans as documented in the 1974 Kissinger Report, otherwise known as the National Security Study Memorandum NSSM 200 [my excerpts]. (See the rest of my Depop series listed at the end of the article.)
As secret reports like 1974 NSSM 200 and the 1974 CIA Report: “A Study of Climatological Research as it Pertains to Intelligence Problems” were being written about the coming cooling/ possible glaciation, Maurice Strong, the Rockefeller’s lapdog, was screaming about ‘Global Warming’ at the UN Conference on the Human Environment, (June 1972.) There he was busytelling the newly formed NGOs to go home and raise hell. NGOs BTW were Strong’s brainchild based on YMCA International who he had worked with. LINK
It is instructive to read Strong’s 1972 Stockholm speech and compare it with the issues of Earth Summit 1992. Strong warned urgently about global warming, the devastation of forests, the loss of biodiversity, polluted oceans, the population time bomb. Then as now, he invited to the conference the brand-new environmental NGOs [non-governmental organizations]: he gave them money to come; they were invited to raise hell at home. After Stockholm, environment issues became part of the administrative framework in Canada, the U.S., Britain, and Europe. http://www.afn.org/~govern/strong.html
A year later the Rockefeller OPEC puppets — Think ARAMCO who Strong worked for — implemented the 1973 oil embargo quadrupling the price of oil by 1974. Remember, on August 15, 1971, President Richard Nixon closed the U.S. gold window and the Petrodollar Agreement was implemented in 1973.
“..There was a phony “nationalization” of Aramco in the 1970s… the Saudi government took over Aramco, formally, but then immediately turned around and granted the Aramco-Rockefeller consortium the exclusive contract to “manage” the operation…” LINK
So any bets the Malthusian Rockefellers were behind OPEC?
COOLING VS THE FOOD PROBLEM – First there is the problem of WATER.
I think everyone is aware of what shorter growing seasons do to the food supply, at least I hope so. I also hope people can connect increase in solar energy going into the oceans with an increase of evaporation and thus an increase in rain. Likewise a DECREASE in solar energy will mean less evaporation and less rain. Compared to the Holocene, the Wisconsin Ice Age was very dry.
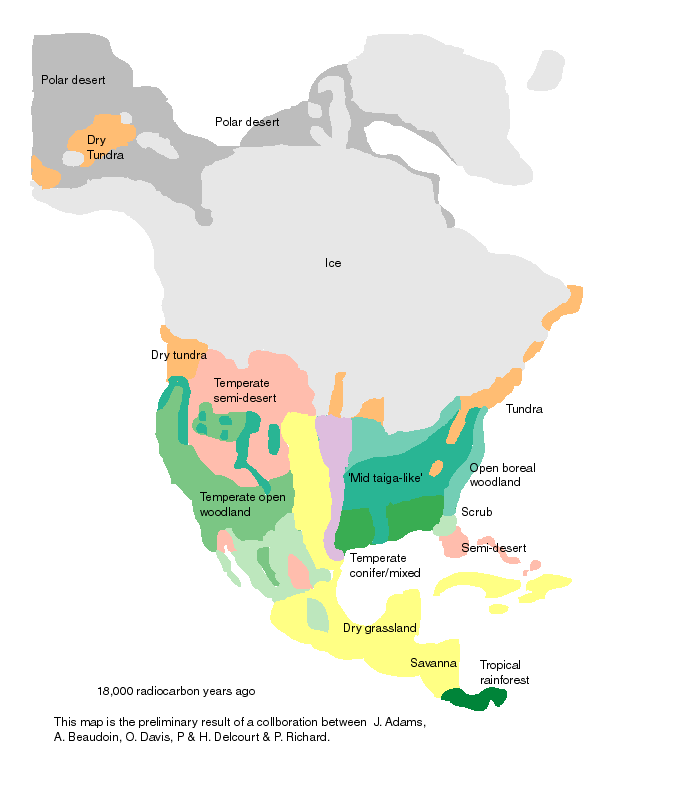
Global land environments since the last interglacial
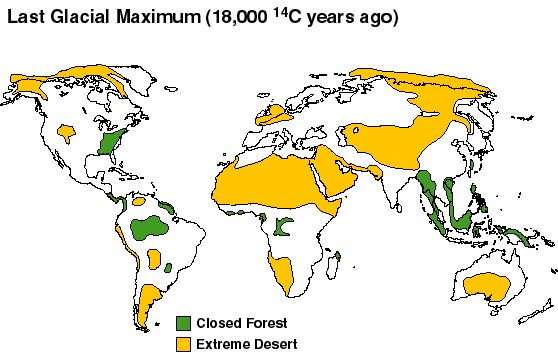
Early Holocene vegetation
“Summary map of vegetation cover at 8,000 14C years BP. By 8,000 14C y.a., the Earth was under a full interglacial climate,[the Holocene]with conditions warmer and moister than present in many parts of the world. Tropical forest in Africa (and probably also Asia) was expanded in area, and the areas of desert in Africa and Asia were much reduced.”
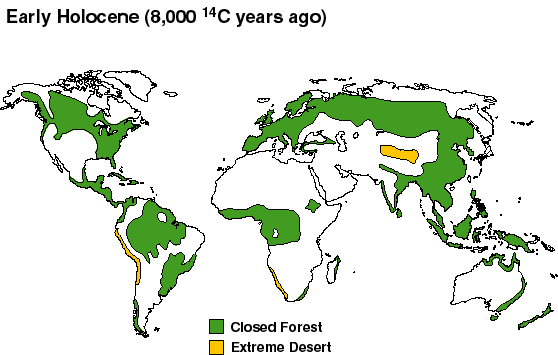
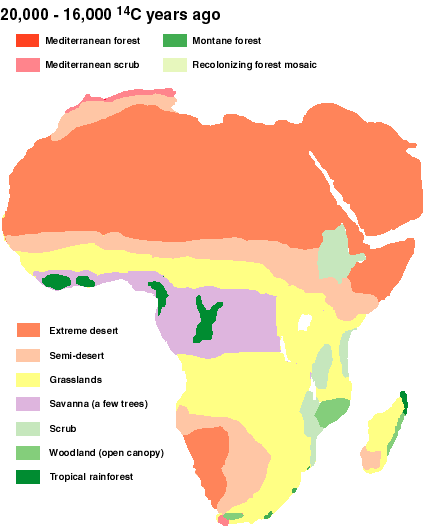
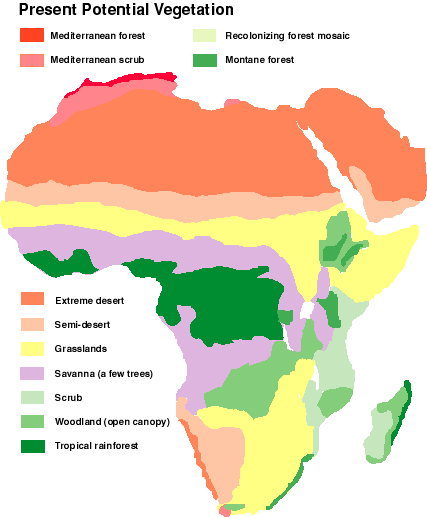
Africa is interesting. The present potential looks more like the full glaciation map than it does like the Early Holocene map.
Full glaciation
Early Holocene
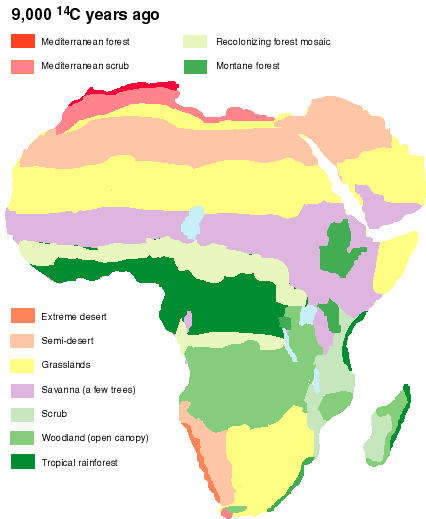
Present Potential
So the first problem in an Ice Age (and now) is the lack of RAIN.
Greenhouses take the chaotic weather out of the picture
Oct 2022 – CO2 enrichment in greenhouse production: Towards a sustainable approach
“The ice that had formed from falling snow during the transition from the last of the cold, dry, windy ice ages to the first of the warm, wet calms of the modern 10,000-year-long Holocene climate is 1,678 meters, just over a mile, down the GISP2 core. Rendered in ice, what exactly would it look like, this boundary of epochs? The young American scientists had read the literature from Chet Langway, Willi Dansgaard, Hans Oeschger, Wally Broecker, and others, and they had heard from the Europeans, who were about a year ahead of them in drilling at Summit. Yet still they were not entirely prepared for what they saw that day in the ice, for the suddenness of it.”…
“‘You did not need to be a trained ice core observer to see this,’ recalled Alley. ‘Ken Taylor is sitting there with the ECM and he’s running along and his green line is going wee, wee, wee, wee – Boing! Weep! Woop! And then it stays down.’ Dust in the windy ice age atmosphere lowered the acidity of the core to a completely new state. ‘We’re just standing there and he just draws a picture of it,”‘Alley said.”….
“𝗜𝗻 𝘁𝗵𝗲 𝗚𝗜𝗦𝗣𝟮 𝘀𝗰𝗶𝗲𝗻𝗰𝗲 𝘁𝗿𝗲𝗻𝗰𝗵, 𝘁𝗵𝗲 𝘁𝗿𝗮𝘆 𝗵𝗼𝗹𝗱𝗶𝗻𝗴 𝘁𝗵𝗲 𝘀𝗲𝗰𝘁𝗶𝗼𝗻 𝗼𝗳 𝗰𝗼𝗿𝗲 𝗿𝗼𝗹𝗹𝗲𝗱 𝗱𝗼𝘄𝗻 𝘁𝗵𝗲 𝗮𝘀𝘀𝗲𝗺𝗯𝗹𝘆 𝗹𝗶𝗻𝗲 𝗮𝗻𝗱 𝘁𝗵𝗲𝗻 𝗶𝘁 𝘄𝗮𝘀 𝗔𝗹𝗹𝗲𝘆’𝘀 𝘁𝘂𝗿𝗻 𝗮𝘁 𝘁𝗵𝗲 𝗶𝗰𝗲. “𝗜𝘁 𝘀𝗹𝗶𝗱𝗲𝘀 𝗮𝗰𝗿𝗼𝘀𝘀 𝗶𝗻 𝗳𝗿𝗼𝗻𝘁 𝗼𝗳 𝗺𝗲 𝗮𝗻𝗱 𝗜’𝗺 𝘁𝗿𝘆𝗶𝗻𝗴 𝘁𝗼 𝗶𝗱𝗲𝗻𝘁𝗶𝗳𝘆 𝘆𝗲𝗮𝗿𝘀: ‘𝗧𝗵𝗮𝘁’𝘀 𝗮 𝘆𝗲𝗮𝗿, 𝘁𝗵𝗮𝘁’𝘀 𝗮 𝘆𝗲𝗮𝗿 𝗮𝗻𝗱 𝘁𝗵𝗮𝘁’𝘀 𝗮 𝘆𝗲𝗮𝗿, 𝗮𝗻𝗱 – 𝘄𝗼𝗼𝗽𝘀, 𝘁𝗵𝗮𝘁 𝗼𝗻𝗲’𝘀 𝗼𝗻𝗹𝘆 𝗵𝗮𝗹𝗳 𝗮𝘀 𝘁𝗵𝗶𝗰𝗸.’ 𝗔𝗻𝗱 𝗶𝘁’𝘀 𝘀𝗶𝘁𝘁𝗶𝗻𝗴 𝘁𝗵𝗲𝗿𝗲 𝗷𝘂𝘀𝘁 𝗹𝗼𝗼𝗸𝗶𝗻𝗴 𝗮𝘁 𝘆𝗼𝘂. 𝗔𝗻𝗱 𝘁𝗵𝗲𝗿𝗲’𝘀 𝗮 𝗵𝘂𝗴𝗲 𝗰𝗵𝗮𝗻𝗴𝗲 𝗶𝗻 𝘁𝗵𝗲 𝗮𝗽𝗽𝗲𝗮𝗿𝗮𝗻𝗰𝗲 𝗼𝗳 𝘁𝗵𝗲 𝗶𝗰𝗲, 𝗶𝘁 𝗴𝗼𝗲𝘀 𝗳𝗿𝗼𝗺 𝗯𝗲𝗶𝗻𝗴 𝗰𝗹𝗲𝗮𝗿 𝘁𝗼 𝗯𝗲𝗶𝗻𝗴 𝗻𝗼𝘁 𝗰𝗹𝗲𝗮𝗿, 𝗵𝗮𝘃𝗶𝗻𝗴 𝗮 𝗹𝗼𝘁 𝗼𝗳 𝗱𝘂𝘀𝘁.” [The clear thick ice would be the Holocene and as they go deeper they see the transition to the Wisconsin Ice Age. – GC]
Paper after paper began to roll off the scientific presses from 1992 on, and just like the unfolding recognition of plate tectonics which preceded it by a few decades, it was literally riveting for all of us geologists fascinated by the Quaternary. So we get our first trap-speed 👉 𝕔𝕝𝕚𝕞𝕒𝕥𝕖 𝕔𝕒𝕟 𝕤𝕨𝕚𝕥𝕔𝕙 𝕒𝕓𝕣𝕦𝕡𝕥𝕝𝕪 𝕗𝕣𝕠𝕞 𝕚𝕥𝕤 𝕔𝕠𝕝𝕕 𝕥𝕠 𝕚𝕥𝕤 𝕨𝕒𝕣𝕞 𝕤𝕥𝕒𝕥𝕖 𝕚𝕟 𝕛𝕦𝕤𝕥 𝕠𝕟𝕖 𝕪𝕖𝕒𝕣.….” — William McClenney, Geologist THE END OF THE HOLOCENE
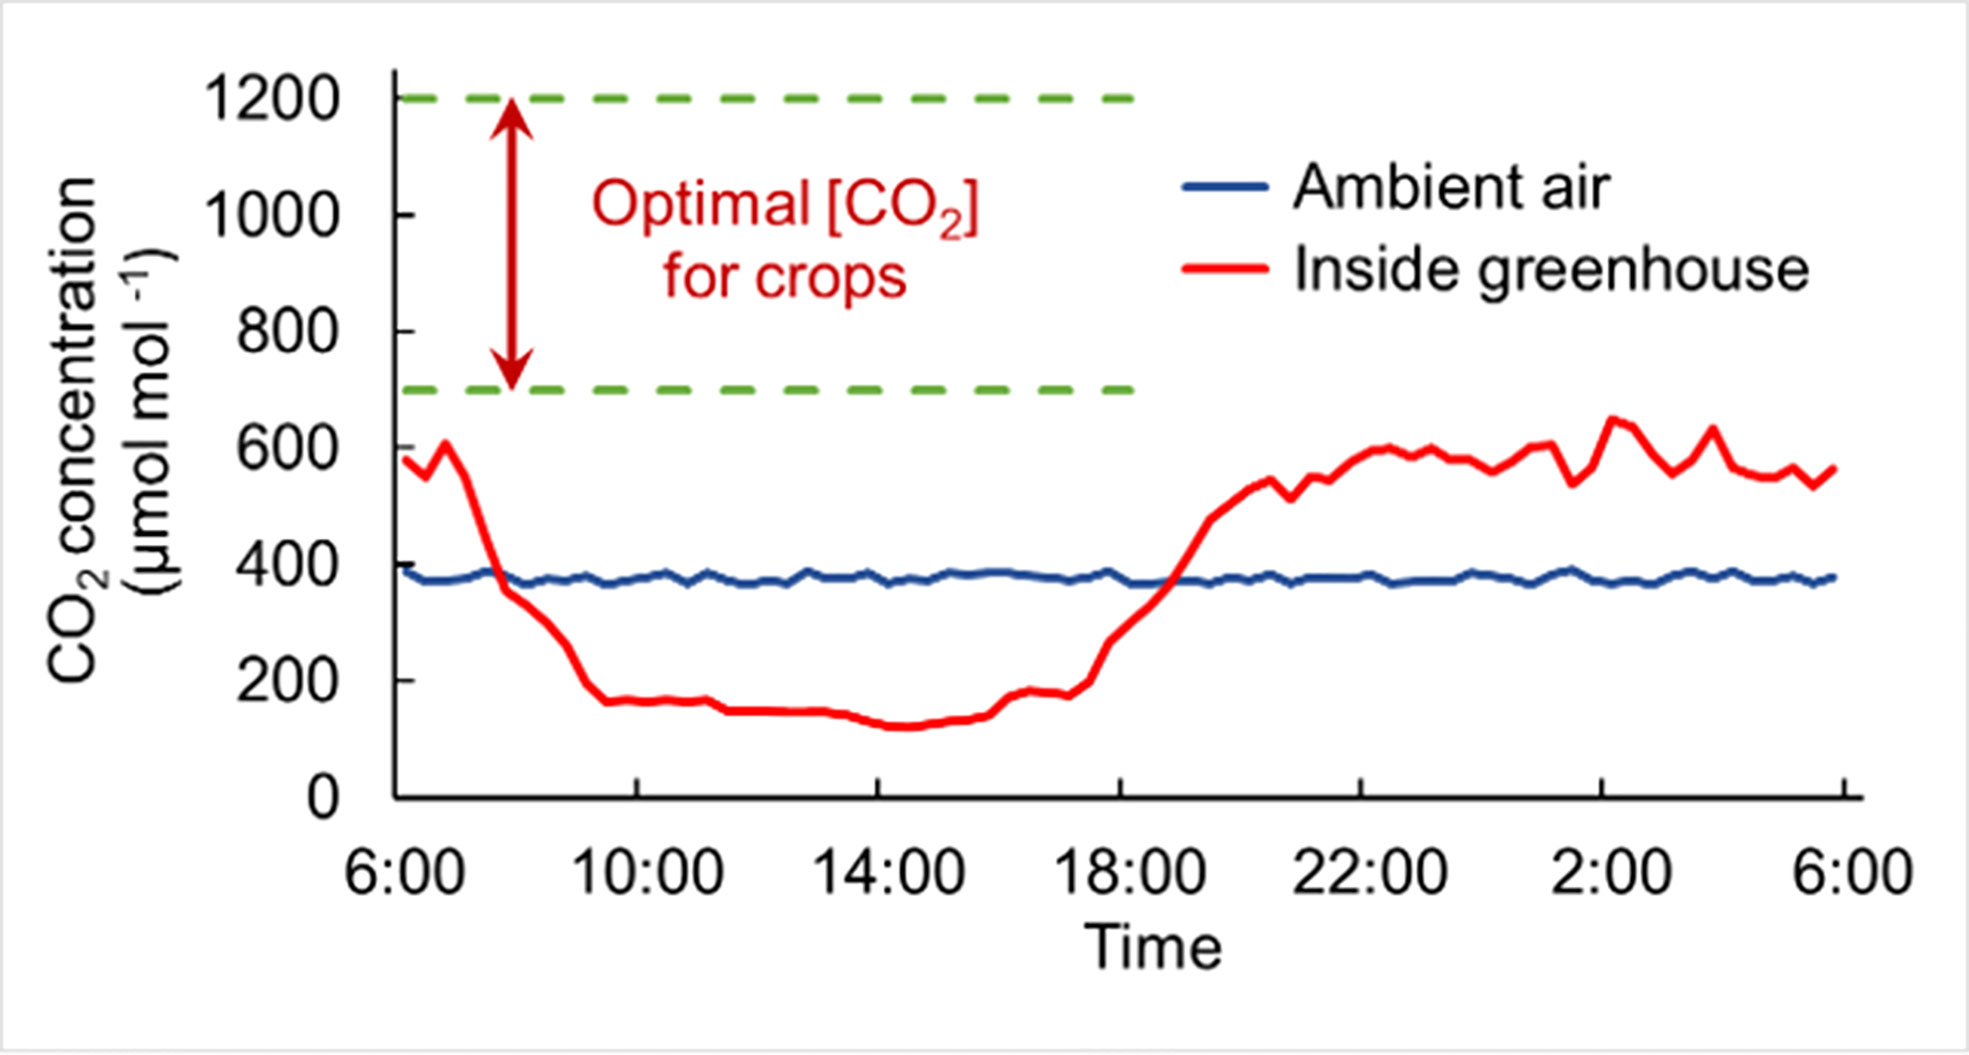
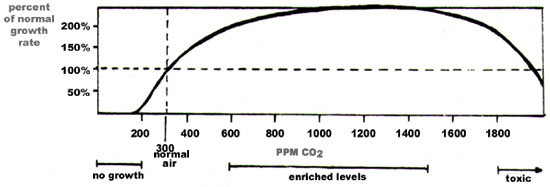
Notice the optimal range is 700 to 1200 PPM over double the current ambient levels. Also note plants suck the CO2 down to around 200 ppm. Outdoor studies have shown the same. Technology has even advanced to the point there is now a CO2 OPTIMIZER.
Growers tend to supplement CO2 in their greenhouse using a combination of educated guesswork and their talent and skill for growing crops. Adding CO2 is a matter of ‘feeling’, because it is simply not possible to measure the effectiveness of CO2. That is, until now. Ridder has, in partnership with Wageningen University, developed the CO2 Optimizer. This smart and helpful software module calculates the optimum level of CO2 in the greenhouse, enabling the grower to determine the most effective CO2 dose. The result: no more worrying about your CO2 strategy – it will always be on point for the best possible yields!
That device would certainly be useful in Ice Age greenhouses.
URANIUM AND NUCLEAR POWER
An obvious solution to the ‘cold, dry, windy ’ problem of an Ice Age is desalination. Israel put into large scale use the reverse osmosis technology developed in the USA in the early 60s. LINK 1 as well as water conservation methods in agriculture LINK 2-Israel agi.
Desalination was first developed in Israel in 1965, when Mekorot, Israel’s national water utility, established the first seawater desalination facility using vaporization technology in an effort to address the chronic thirst of the city of Eilat, located at the extreme southern tip of Israel on the Red Sea. A highly energy-intensive process, Mekorot looked for an alternative, energy-saving process, which it found in the reverse osmosis (RO) technology developed in the United States. In the early 1970s after the energy crisis of the Yom Kippur War, Mekorot began installing small-scale brackish water RO-desalination plants and, within the decade, established 15 desalination plants that supplied water to the Arava valley residents. Increasing demand and decreasing supply of freshwater in the coming years encouraged Mekorot to develop seawater desalination as an additional source, and the first plant (which desalinated a mixture of seawater and the reject brine from desalinated brackish water) commenced operation in 1997 in Eilat (Mekorot 2006). The motivation behind desalination of seawater in Israel stems from the fact that current demand and projected future demand cannot be met by natural freshwater sources alone – a disparity that results from population growth, overconsumption, misallocation, and pollution…
https://arava.org/wp-content/uploads/2015/05/Desalination-in-Israel.pdf
International Atomic Energy Agency. (2010). Environmental Impact Assessment of Nuclear Desalination
Description
Nuclear desalination can be considered one of the most viable means of producing fresh water in arid areas. This publication addresses environmental concerns, and aims to improve understanding. It provides an overview of the nature and magnitude of the environmental impacts of nuclear desalination. In addition to detailing experimental data and the experience gained in operating nuclear desalination projects, it highlights risks perceived by the public. The publication encompasses environmental and socioeconomic information provided by specialized sources including some Member States with extensive experience in operating nuclear desalination systems. Addressing these concerns can be of critical importance for the effective use of nuclear desalination to its full potential….
Jul 14, 2019, FORBES: How 1,500 Nuclear-Powered Water Desalination Plants Could Save The World From Desertification
Oct 21, 2022, FORBES: U.S. Nuclear Reactors Among The Oldest In The World
The latest edition of the World Nuclear Industry Status Report shows that U.S. nuclear power plants are among the oldest in the world. The country’s 92 reactors currently in operation have a mean age of 41.6 years….
The U.S. was among the first commercial adopters of nuclear energy in the 1950s, explaining the number of aging reactors today.A building boom between the 1960s and 1970s created today’s nuclear power plants in the United States. Of the five reactors completed in the 1990s and the one finished in 2016, all were holdovers of delayed construction projects from the 1970s experiencing roadblocks due to regulatory problems and mounting opposition to nuclear energy…
So despite nuclear energy being CO2 neutral and the southwest’s need for water, the USA has not approved new construction since the 1970s…. There is that critical 1970s decade again when everything changed.
Paul Ehrlich, “An Ecologist’s Perspective on Nuclear Power”, May/June 1978 issue of Federation of American Scientists Public Issue Report
Giving society cheap, abundant energy … would be the equivalent of giving an idiot child a machine gun.
2014 – Clinton and Obama science advisor, John Holdren, in his own (radical) words – (Don’t miss the comments about bioweapons released by the USA on the Mexican border.)
Ehrlich and Holdren were co-authors of The Population Bomb (1968.) A real pair of winners, those two.
Back to The Köppen Climate Boundary.
Not only was the area in the USA/Canada/Russia/China moved south by 100 to 200 miles in the seventies, CO2 is very soluble in COLD WATER (van ‘t Hoff equation.) So as the earth cools CO2 gets sucked up by the oceans thereby lowering the amount of CO2 available for plants.

As ocean temperatures rise, the solubility of CO2 in seawater declines. Thus increasing ocean temperature moves CO2 from the ocean into the atmosphere, and decreasing ocean temperatures move CO2 out of the atmosphere and back into the ocean. As you can see in the graph below, a 10C shift in temperature causes about 30% reduction in dissolved CO2. Closely corresponding to what we see in the measured ice core graph above. — Tony Heller

Under stress seeds will not even start and the cut off is ~220 ppm CO2. The Climastrologists played games with the measurements of ice cores and came up with 150. AGAIN the chemistry is CO2 loves water so the air bubbles have less CO2 than the entire ice sample. Dr Zbigniew Jaworowski explains that dis-info campaign HERE.
Jaworowski data is backed up by plant fossils.
The CO2 Record in Plant Fossils
Plant fossils obtained from sedimentary rocks and peat deposits are a relatively new tool being used to unravel Earth’s carbon dioxide (CO2) history. Tiny pores on plant leaves and needles called stomata regulate carbon dioxide absorption and water vapor release. Stomata numbers decrease during times of high atmospheric CO2, and increase when atmospheric CO2 is low….
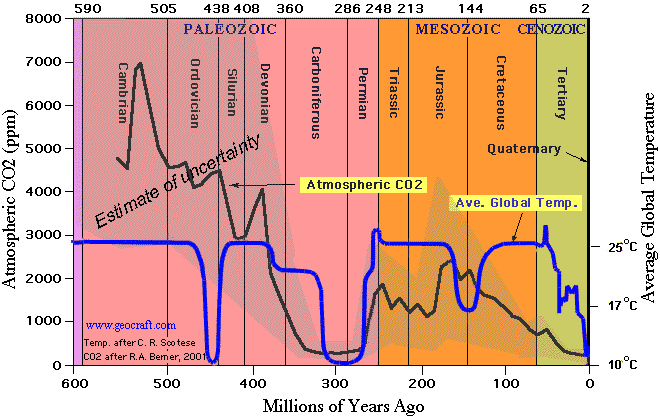
Global Temperature and Atmospheric CO2 over Geologic Time
CO2 and our Food Supply
Most of our veggies and fruit are C3 not C4.
C3 Plants
The vast majority of land plants we rely on for human food and energy use the C3 pathway, which is the oldest of the pathways for carbon fixation, and it is found in plants of all taxonomies. Almost all extant nonhuman primates across all body sizes, including prosimians, new and old world monkeys, and all the apes—even those who live in regions with C4 and CAM plants—depend on C3 plants for sustenance….
The problem is the C3 pathway needs more water and CO2 than the C4 pathway and both were in short supply during the last Ice Age and are certainly not at optimum levels now as shown by the African desertification since the Holocene Optimum.
Carbon starvation in glacial trees recovered from the La Brea tar pits, southern California (THINK SEA LEVEL!)
Abstract
The Rancho La Brea tar pit fossil collection includes Juniperus (C3) wood specimens that 14C date between 7.7 and 55 thousand years (kyr) B.P., providing a constrained record of plant response for southern California during the last glacial period. Atmospheric CO2 concentration ([CO2]) ranged between 180 and 220 ppm during glacial periods, rose to 280 ppm before the industrial period, and is currently approaching 380 ppm in the modern atmosphere. Here we report on [delta]13C of Juniperus wood cellulose, and show that glacial and modern trees were operating at similar leaf- intercellular [CO2](ci)/atmospheric [CO2](ca) values. As a result, glacial trees were operating at ci values much closer to the CO2-compensation point for C3 photosynthesis than modern trees, indicating that glacial trees were undergoing carbon starvation. In addition, we modeled relative humidity by using [delta]18O of cellulose from the same Juniperus specimens and found that glacial humidity was 10% higher than that in modern times, indicating that differences in vapor-pressure deficits did not impose additional constrictions on ci/ca in the past. By scaling ancient ci values to plant growth by using modern relationships, we found evidence that C3 primary productivity was greatly diminished in southern California during the last glacial period.
“…glacial humidity was 10% higher than that in modern times…” as the below maps show. This may indicate why the Cabal wants California and the US Southwest cleared of those pesky ‘Deplorables.’
At the most extreme stage of the last glaciation, most of Canada and much of the northern USA were covered by an ice sheet thousands of metres in thickness. Colder and often drier than present conditions predominated across most of the USA. The eastern deciduous and conifer forests were replaced by more open conifer woodlands with cooler-climate species of pines and a large component of spruce. The open spruce woodland and parkland extended somewhat further west than present, into what is now the prairie zone. As a result of aridity and lowering of sea level (which lowered inland water tables), much of Florida was covered by drifting sand dunes. Notably moister than present conditions occurred across much of the south-west, with open conifer woodlands and scrub common in areas that are now semi-desert.
1998 Carbon dioxide starvation, the development of C4 ecosystems, and mammalian evolution
ABSTRACT
The decline of atmospheric CO2 over the last 65 million years (Ma) resulted in the ‘CO2-starvation’ of terrestrial ecosystems and led to the widespread distribution of C4 plants, which are less sensitive to CO2 levels than are C3 plants. Global expansion of C4 biomass is recorded in the diets of mammals from Asia, Africa, North America, and South America during the interval from about 8 to 5 Ma. This was accompanied by the most significant Cenozoic faunal turnover on each of these continents, indicating that ecological changes at this time were an important factor in mammalian extinction. Further expansion of tropical C4 biomass in Africa also occurred during the last glacial interval confirming the link between atmospheric CO2 levels and C4 biomass response. Changes in fauna and flora at the end of the Miocene, and between the last glacial and interglacial, have previously been attributed to changes in aridity; however, an alternative explanation for a global expansion of C4 biomass is CO2 starvation of C3 plants when atmospheric CO2 levels dropped below a threshold significant to C3 plants. Aridity may also have been a factor in the expansion of C4 ecosystems but one that was secondary to, and perhaps because of, gradually decreasing CO2 concentrations in the atmosphere. Mammalian evolution in the late Neogene, then, may be related to the CO2 starvation of C3 ecosystems.
Lower CO2 levels PLUS lower moisture with a COLD boot from glaciation did lead to the evolution of C4 and CAM plants which use a different but more energy expensive chemical pathway to conserve water.
Philosophical Transactions of the Royal Society -biological sciences -1998
Carbon dioxide starvation, the development of C4 ecosystems, and mammalian evolution
…Changes in fauna and flora at the end of the Miocene, and between the last glacial and interglacial, have previously been attributed to changes in aridity; however, an alternative explanation for a global expansion of C4 biomass is carbon dioxide starvation of C3 plants when atmospheric carbon dioxide levels dropped below a threshold significant to C3 plants. Aridity may also have been a factor in the expansion of C4 ecosystems but one that was secondary to, and perhaps because of, gradually decreasing carbon dioxide concentrations in the atmosphere. Mammalian evolution in the late Neogene, then, may be related to the carbon dioxide starvation of C3 ecosystems.
The Evolution of C4 Photosynthesis
SUMMARY
C4 photosynthesis is a series of anatomical and biochemical modifications that concentrate CO2 around the carboxylating enzyme Rubisco, thereby increasing photo-synthetic efficiency in conditions promoting high rates of photo-respiration. The C4 pathway independently evolved over 45 times in 19 families of angiosperms, and thus represents one of the most convergent of evolutionary phenomena. Most origins of C4 photosynthesis occurred in the dicots, with at least 30 lineages. C4 photosynthesis first arose in grasses, probably during the Oligocene epoch (24–35 million yr ago). The earliest C4 dicots are likely members of the Chenopodiaceae dating back 15–21 million yr; however, most C4 dicot lineages are estimated to have appeared relatively recently, perhaps less than 5 million yr ago. C4 photosynthesis in the dicots originated in arid regions of low latitude, implicating combined effects of heat, drought and/or salinity as important conditions promoting C4 evolution. Low atmospheric CO2 is a significant contributing factor, because it is required for high rates of photorespiration. Consistently, the appearance of C4 plants in the evolutionary record coincides with periods of increasing global aridification and declining atmospheric CO2. Gene duplication followed by neo- and nonfunctionalization are the leading mechanisms for creating C4 genomes, with selection for carbon conservation traits under conditions promoting high photo respiration being the ultimate factor behind the origin of C4 photosynthesis.
Speaking of plants, while scientists will lie to keep the grant money coming, plants do not.
Latitude says: December 23, 2015 at 8:21 pm
Gail, put this in your bookmarks…….they found the cut off was 220 ppm….not 200
I don’t know where people got the idea that it’s 150 and keep repeating that….220 stops themhttp://onlinelibrary.wiley.com/doi/10.1111/j.1469-8137.2010.03441.x/pdf
What is interesting is ALL the archived versions of this June 2010 paper prior to September 28, 2019 have been scrubbed…
Side note on ‘disappearing’ info: Climate Alarmism Central actually does exist. It is part of the Aspen Global Change Institute. I will be getting into that mess in my next article.
This is what that paper now says:
2010 – Plant responses to low [CO2] of the past
Biomass production
…Such studies have shown that the average biomass production of modern C3 plants is reduced by c. 50% when grown at low (180–220 ppm) vs modern (350–380 ppm) [CO2], when other conditions are optimal (Sage & Coleman, 2001; Fig. 5). There is, however, variation in this response among C3 species (Fig. 5), as well as within C3 species, whereby reductions in biomass may vary by 40–70% among genotypes (Ward & Strain, 1997; Hovenden & Schimanski, 2000; Mohan et al., 2004). In addition, as [CO2] declines to 150 ppm, biomass production may be reduced by as much as 92%, as was observed in A. theophrasti (Dippery et al., 1995; Figs 2, 5)….
Notice the LIE by omission? They are talking BIOMASS and not how well the plants do from seed germination to producing the seeds for the next generation during a growing season.. Under stress the seeds will not even start to grow.
Seed dormancy and ABA signaling
The biology of seeds can be divided in three important phases: development that includes zygotic embryogenesis, dormancy that prevents seeds from germinating under unfavorable conditions and germination (seed emergence). The transition between dormancy and germination represents a critical stage in the life cycle of higher plants and it is an important ecological and commercial trait. Seed germination is regulated by endogenous hormonal cues and external environmental signals such as water, low temperature and light, which influence whether an imbibed seed completes germination or remains dormant. Seed dormancy, a temporary quiescent state that is observed in seeds from many plants species, prevents untimely germination and ensures plant survival by adjusting vegetative development to seasonal changes in the environment. A dynamic balance between synthesis and catabolism of the abscisic acid (ABA) and gibberellins (GAs) controls the equilibrium between dormancy and germination. At the molecular level, the ABA/GA balance is in part determined by the antagonistic control of ABA and GA on each other through their reciprocal regulation of the transcription of their metabolic genes.
The ABA, derived from epoxycarotenoid cleavage, serves as a plant-specific signal during development and in response to environmental stresses such as cold, drought and high concentrations of salt in the soil. The ABA also elicits, among others numerous physiological functions, the closure of stomatal pores to restrict transpiration, adjustment of metabolism to tolerate desiccation and cold temperatures, and inhibition seedlings growth. Likewise, ABA represses germination and is presumed to function to stabilize the dormant state. ABA, like other hormones, functions through a complex network of signaling pathways where the cell response is initiated by ABA perception which triggers downstream signaling cascades to induce the final physiological effects….
Even C4 plants do better in higher CO2 atmospheres.
C4 Plants (Water Use Efficiency) — Summary
…In summary, it is clear that C4 plants do indeed respond positively to increases in the air’s CO2 concentration by exhibiting reduced stomatal conductances and transpirational water losses, which contribute to increases in water-use efficiency. Hence, knowledgeable researchers are suggesting that the long-held view that C4 plants will not be benefited by elevated concentrations of atmospheric CO2 needs to be replaced with this more correct assessment (Wand et al., 1999; Zhu et al., 1999). Clearly, as the atmospheric CO2 concentration increases, most C4 plants will almost certainly display increases in water-use efficiency, which should allow them to better deal with conditions of water stress. Consequently, this phenomenon should allow plants of the future to expand their ranges into areas where they currently cannot survive due to limited soil moisture availability, thereby contributing to a great “greening of the globe.”
There is another more subtle aspect to the CO2 starvation level and that is the change in partial pressure as the elevation above sea level increases.
Impact of lower atmospheric carbon dioxide on tropical mountain ecosystems
…. Carbon limitation due to lower ambient CO2 partial pressures had a significant impact on the distribution of forest on the tropical mountains, in addition to climate. Hence, tree line elevation should not be used to infer palaeotemperatures….
Effect of Low Glacial Atmospheric CO2 on Tropical African Montane Vegetation
Abstract
Estimates of glacial-interglacial climate change in tropical Africa have varied widely. Results from a process-based vegetation model show how montane vegetation in East Africa shifts with changes in both carbon dioxide concentration and climate. For the last glacial maximum, the change in atmospheric carbon dioxide concentration alone could explain the observed replacement of tropical montane forest by a scrub biome. This result implies that estimates of the last glacial maximum tropical cooling based on tree- line shifts must be revised.”
Eco Physics Lab PDF: Glacial trees from the La Brea tar pits show physiological constraints of low CO2
…While [CO2] does not vary with elevation, CO2 partial pressure decreases in proportion to total atmospheric pressure. Under modern conditions, partial pressures of CO2 at high-elevation sites are 10–30% lower than at low-elevation sites, producing an even more conservative comparison between glacial and modern conditions….
That means if the CO2 level is around 210 ppm you can kiss trees and other C3 plants growing above sea level goodby and that is most of the earth.
…According to Barnola et al (1987) the level of CO2 in the global atmosphere during many tens of thousands of years spanning 30,000 to110,000 BP were below 200ppm. If this were true then the growth of C3 plants should be limited at the global scale because their net Photosynthesis is depressed as CO2 concentration in air decreases to less than about 250ubar (less than about 250ppmv)(McKay et al 1991) This would lead to the extinction of C3 plant species . This has however not been recorded by paleobotanists (Manum 1991).”
http://www.co2web.info/stoten92.pdf
Again, plants do not lie but the scientists owned by the Cabal do.
Since I have mentioned Köppen several times and I remember this information but not who said it, I feel it only fair to post E.M. Smith’s (ChiefIO‘s) comment:
From “Ice Age” by John and Mary Gribbin (a wonderful read, gives the richness of the characters in the discovery of the ice ages, the history of the process, and a gentle introduction to some of the science involved.):
Pg.53: […]the single most important thing to emerge from these discussions was Koppen’s realization of the key season in the Ice Age saga. Adhemar and Croll had thought that the decisive factor in encouraging Ice to spread across the Northern Hemisphere must be the occurrence of extremely cold winters, resulting in increased snowfall. At first, Milankovitch had shared this view. But it was Koppen who pointed out that it is always cold enough for snow to fall in the Arctic winter, even today, and that the reason that the Northern Hemisphere is not in the grip of a full Ice Age is because the ‘extra’ snow melts away again in the summer.
[EMS: Note that the Southern Hemisphere is similarly irrelevant to the ice age cycle since it is always cold enough for snow to stay frozen. It just doesn’t change enough to matter.]
Pg 54: He reasoned that the way to encourage the ice to spread would be to have a reduction in summer warmth, because then less of the winter snowfall would melt. If less snow melted in summer than fell in winter, the ice sheets would grow – and once they had started to grow, the feedback effect of the way the ice and snow reflect away incoming solar energy would enhance the process.
Pg 57: It isn’t so much that Ice Ages occur when the astronomical influences conspire to produce particularly cool summers, rather what matters is that Interglacials only occur when the astronomical influences conspire to produce unusually warm summers, encouraging the ice to retreat. Without all three of the astronomical rhythms working in step this way, the Earth stays in a deep freeze.
End Quote.
So, to summarize:
1) The south pole doesn’t matter to the process, it’s always frozen.
2) We are normally in a long ice age and only pop out for short intervals when conditions are just right.
3) The ‘just right’ is Northern Hemisphere summers warm enough to melt the snow and ice.
4) Warm enough is when the N. hemisphere: must be pointed at the sun in summer when: at close approach to the sun with the right elliptical shape, with the pole tilted over far enough, with… or we freeze.
I would add a note that I think it is particularly illuminating that we are near the end of an Interglacial (next stop is an ice age), the only thing that keeps it away is the summer Arctic ice and snow melt. So what is the AGW crowd in histrionics about? That the Arctic ice and snow are not sticking through the summer… Think about….
Right now Earth is nearest the sun during northern winters, farthest from the sun during northern summers. If E.M. Smith’s theory is correct, we’re headed for another ice age in the near future. This shift is called the precession of the equinoxes and has a period of 26,000 years. In only 12,000 years the perihelion will be in July. The summer solstice, 21 June @ 65◦ N is what most scientist use for measuring the critical solar insolation.
“As of 2014 the Holocene is exactly 11,717 years old (based on the end of the Younger Dryas cold interval). Or pretty much about half a precession cycle.” — William McClenney
Now, in 2023 it is 11726 years and we just went through the warm bump before the dive into the cold….
And one last word from Tony Heller:


Just as a point for style, posts that lay out all the facts don’t leave much room for comments. If you included a question, left something out, or cited something that was obviously wrong, more people would probably comment.
🙂
AHHHhhhh but my reason for doing these articles is to lay out all the facts so they can serve as a reference.
I appreciate that method as well as the time and effort you put in on the article. It’s definitely sobering.
ThankQ.
It is nice to be able to organize and share my research and thoughts. I only hope I am clear enough so others can follow what I am seeing.
Following very well and greatly appreciate.


Appreciate the entire depop series. Like the layout. Admittedly, rereading essential for me. But that is a slow guy factor. NOT, the information as provided.
It is a lot of info Kalbo, but I wanted to make sure I had very solid overwhelming evidence for this series.
All good.
Solid overwhelming evidence it is AND THAT is appreciated also.
FWIW. I’ve copied the depop series for future reference, IF WP acts up. Rather sure you have back ups, likely Wolf also.
Notices that Chemists got a small shout out for their assistance to archeology as early 1902 (page iv from the preface of “The Artic Home In the Vedas” by B.J.Tilak).
https://archive.org/details/arctichm/mode/2up
Much controversy still exists with this book. Some think Queen Victoria put the kibosh on any theories toward Indian Antiquity going past the Age of Alexander the Great for payback in severing ties with Great Britain, as the primary reason.
The Vedic passages referring to an Artic Homeland for the most part appear unassailable, however they continue to attack the scientific data on the climate and call the book pseudohistory, which seems out of line given they can not argue historicity of the Vedas.
Here are Tilak’s notions on climate during the period in question.
Tilak’s Arctic homeland hypothesis[edit]
Tilak in his Study
According to Tilak, writing at the end of the 19th century, the Neolithic Aryan race in Europe cannot be regarded as autochthonous, nor did the European Aryans descend from the Paleolithic man. Hence, the question of the original Aryan home is regarded as unsettled by Tilak.
According to Tilak, the close of the Pliocene and the whole of the Pleistocene period were marked by violent changes of climate bringing on what is called the Glacial and Inter-Glacial epochs:
The Arctic was inhabited by the Aryans. The ending of the Glacial age changed the climate there, and set the Aryan people on a migration to new habitats:
Characteristics of an Arctic home, characterised by a climate different from today’s, are clearly recorded in several Vedic hymns and Avestic passages. There are descriptions of the prevailing conditions and of the day-to-day experience, but also recordings of stories told by the earlier generation, sometimes presented as myths. Tilak gives the following chronology of the post-glacial period:
Some of that may well be wrong, example Alps & Himalayas but the bulk of it is likely correct and or could push the dates further back in prehistory given known data now as best as I can tell.
Mystery of the Mammoth and the Buttercups
Buttercup
Chapter 1Frozen Mammoth Carcasses in Siberiaby Michael J. Oard on October 1, 2004
Featured in Frozen in Time
Read somewhere that vast groups of forests are being clearcut, thus making it difficult for us to throw another log on the fire in the future.
I would not be at all surprised. England is now using wood chips instead of coal in their electric generating facilities.
2021: A burning issue: biomass is the biggest source of renewable energy consumed in the UK
Talk about SHEAR STUPIDITY! How much OIL is burned processing trees into pellets and then transporting them?
Of course, WE the serfs can not use the wood…
October 2, 2013 EPA Bans Most Wood-Burning Stoves
Are Wood Stoves & Wood Fireplaces Illegal? (Answered)
Didn’t they recently plow down much old growth forests in Germany ?
For wind mills…
Which they, then, had to tear down to expand a coal mine.
https://www.ecowatch.com/germany-coal-wind-energy-crisis.html
Figures…🙄
More on the sleight of hand the Cabal tame scientists used to change prehistoric CO2 levels to a much lower levelfrom a decade old comment of mine.
This is the study that was originally used to lower the level C3 starvation by relying on the ‘New’ Ice Core data derived from air bubbles within the ice cores. It is the study Jaworowski, Segalstad and Ono challenged.
The ice core analysis method switched from an analysis of the WHOLE SAMPLE to analysis of the CO2 left in the air bubble. This newer method gives much lower CO2 numbers. that do not agree with the older numbers or with the plant stomata data. SEE: link
NOTE: This is another link that JUST WENT DEAD WHILE I WAS WRITING THIS ARTICLE! The March 2023 archive version
https://web.archive.org/web/20230313163218/http://www.greenworldtrust.org.uk/Science/Scientific/CO2-ice-HS.htm
This is a very good source compiling a lot of information.
>>>>>>>>>>>>>
Stomata data by Wagner, Aaby and Visscher prove conclusively that the ice core data is seriously in error. The ice core data can be corrected using J.J.Drake’s correlation, the profile does not change but the ppm values do so the analysis is still valid.
http://www.pnas.org/content/99/19/12011.full.pdf
In general the stomata research totally destroys the ice core data.
A couple decades ago when I first comment on this there was a Peer-reviewed paper saying C3 plants starve below 200 ppm. It was of course COMPLETELY removed from the internet.
So now we have to go to the people who know and depend on the truth – FARMERS (Farmers overwhelmingly think CAGW is organic fertilizer. Iowa State Univ polled nearly 5,000 farmers. 66 % believed climate change is occurring, but only 41 percent believed humans bore any part of the blame for global warming, thus 75% rejected CAGW. Other studies show numbers over 80% reject CAGW.)
….
Hydroponic Shop
Another dead link:
2010: https://web.archive.org/web/20110429195159/http://www.thehydroponicsshop.com.au/
(Note the actual link is not archived but this at least is about Hydroponics)
The 2014 link is even worse! Comparing Underwater And Land-Based Exercises?? … Small Bathroom Makeovers, Big Effects??? WTF?
https://web.archive.org/web/20110429195159/http://www.thehydroponicsshop.com.au/
…
GREENAIR
Again a dead link. More recent archive versions return 404 or ERROR. Until you get back to Aug 2016, just before Trump’s election.
https://web.archive.org/web/20160803223834/https://greenair.com/old/pdf/efs/co2-efs.pdf
….
HYDROFARM
CO2 vs Plant Growth GRAPH
NEW IMAGE:
The present site kowtows to the CO2 gods before addressing plants need for CO2.
>>>>>>>>>>>>>>>>>>>>>
Speaking of people with direct knowledge, there is this comment from a guy posting at Tony Heller’s. He TRASHES the above graph.
Marsh says:
December 23, 2015 at 11:45 am
Gail, thank you for all your good research.
You are very welcome Zoe. I want to provide REAL DOCUMENTATION that can be used in our fight against the Deep State Cabal.
It will not work on the brain-dead or paid bots, but it will work on the fence sitters.
Gail, I’m not a scientist and still can’t understand why they want to destroy co2? Is it just to lower population?
No it is because they want to conserve CO2 producing petroleum and coal products for use when the CO2 levels become too low.
They also want to reduce the population to BELOW 3 billion at least. That was the world population in the 1970s when they had the food scarcity scare.
They are probably not going to have to worry about depopping down to that number now. The jabs will take care of a big portion of it combined with gender/sexual perversion, wars, etc.
The shut off of all things driven by coal and petroleum was glaringly obvious. The shut down of nuclear was bizarre. They used waste disposal methodology excuses for decades on it. Which is bogus, but a media talking point for sufficient fear porn.
Such a good series, Gail.
ThankQ.
It certainly seems like the logical reason why things changed so suddenly around 1974.
Appears the Depop links right side can use some updating.
This article and a few others links missing.
Guessing this is a Wolf thing, his time permitting.
I looked but could not figure it out. Then again I am ‘Computer challenged” 😜
This too good not to post:
Slaynews.com reports: William Happer, professor emeritus in physics at Princeton University, and Richard Lindzen, professor emeritus of atmospheric science at Massachusetts Institute of Technology (MIT), have both gone on the record to warn that the claims made by Biden’s EPA are based on a “hoax” and only serve to advance the globalist green agenda….
I had the honor of attending Dr Happer’s lecture a few years ago on Sept 8, 2014 at UNC. Darryl @ Tony Heller’s had alerted me. I even got one of my
Contains audio and slides of lecture to physics grad students plus a video of the John Locke Foundation lecture for non-physicists:
http://www.sealevel.info/Happer_UNC_2014-09-08/
Slides: http://www.sealevel.info/Happer_UNC_2014-09-08/UNC-9-8-2014.pptx
Video: (toned down for non physics grad students)
[video src="http://jlf.streamhammer.com/speakers/williamhapper090814.mp4" /]
I wrote this comment for Tony’s blog after the lecture:
I did go to Dr. Will Happer’s Lecture. It was cold and drizzly but there was a respectable crowd. At the ‘reception’ before the lecture we were told it was for physics grad students so I was a bit surprised I could follow the entire lecture without getting lost. It takes a very good speaker to be able to engage people at two different levels of understanding.
There were a lot of equations of course but the take away was the CO2 ‘modeling’ is a mish-mash of theoretical equations and experimentally derived data. Where the Climate alarmists missed the boat is in using equations for ‘line broadening’ aka the ‘wings’ where the current CO2 absorption ( at 400 ppm) is supposedly taking place. These equations produce results that do not match up to the experimental data. The lines are not as broad as theory would have it and this was the point of the lecture. Why was the theory wrong?
Dr. Will Happer did agree with what Dr Brown and Peter Malcombe said about the time to radiate being about ten times slower than the time to the next collision in the troposphere. Dr Happer in his lecture also answered my question about where CO2 energy is radiated instead of being handed off via collision. Experimental data shows barely any radiation at 11 KM and that radiating is in the stratosphere ~ 47 KM above the surface.
He did get some very timid Warmists who tried to trip him up with questions about CAGW and not about the lecture. One tried to get him to agree that since the models got ‘history’ correct and they were only wrong for the last few years then they got CO2’s effect on climate correct.
Dr.Happer quoted John von Neumann’s “With four parameters I can fit an elephant, and with five I can make him wiggle his trunk” to explain how easy it was to fit history and then quoted Feynmen about the testing of a theory is how well it can make predictions. Luckily at the very end of the lecture he had shown the video clip of Feynman saying:
First we guess it. Then we compute the consequences of the guess to see what would be implied if this law that we guessed is right. Then we compare the result of the computation to nature, with experiment or experience, compare it directly with observation, to see if it works. If it disagrees with experiment it is wrong. In that simple statement is the key to science. It does not make any difference how beautiful your guess is. It does not make any difference how smart you are, who made the guess, or what his name is – if it disagrees with experiment it is wrong. That is all there is to it.
There was another question/statement that only CO2 could explain the climate and if I remember correctly the person brought in the “heat hiding in the oceans” to explain the current ‘pause. Dr.Happer got a bit of the deer in the headlights look so I chimed in with the Earthshine/albedo inflection point and Dr Happer ran with it.
I really wish I could have gotten a copy of his slides since there was an awful lot of very good but very technical information in the lecture. That was the bad news. The good news is he is writing a paper on his findings with Freeman Dyson so with luck all that great information will be freely available on the net.
And so is this since it ALSO goes towards DEPOPULATION.
I wrote about Vaccines for children HERE:
[QUOTE]
Perhaps the hardest concept for Americans to learn is Our Ruling Class views us with contempt. They do not hate us. To hate you have to view a person as an equal. The Ruling Class does not consider us equals, some do not even consider us ‘human’!!! We are just ‘Human Resources’ for them to use as they please. Once you realize they view us as free range slaves or cattle (chattel) their inhumane treatment of us becomes comprehensible and this plays into their views on vaccination. As long as THEY make money and the ‘Human Resource’ losses are ‘acceptable’ they don’t care if we are injured or die…
[UNQUOTE]
This was before I realized they were INTENTIONALLY killing us for a reason.
Forgot the article link
Moar AND Logic — Vaccines
https://www.theqtree.com/2019/06/16/moar-and-logic-vaccines/
I am going to add Wolfie’s article on The Grand Energy Treason Conspiracy (in Ukraine) since it dovetails so nicely with this article.
Wolfie’s article has this video on the sun’s expected changes.
Read Professor Zharkova’s latest research at http://www.nature.com/articles/srep15689
It seems the famine is already here:
This Is The Worst Global Food Crisis In Modern History, And It Is About To Go To An Entirely New Level
H/T to Valerie Curren, this goes towards evidence the Holocene maybe ending.
https://electroverse.info/record-gains-posted-on-the-greenland-ice-sheet-re-glaciation-on-sierra-nevada/
A 12+ gigaton gain has been posted by the Greenland Ice Sheet, the highest daily total ever recorded in DMI record books dating back to 1981.
WOW Elon ‘GETS IT’
H/T to TheseTruths for this comment:
Elon Musk:
https://nitter.net/Inversionism/status/1719496946488852756
BTW the text is actually by Inversionism @Inversionism on X.
Three Elon Rogan interview videos. GREAT messaging. Adds to above post. Please take the timeto listen in.
~ Two minutes.
https://rumble.com/v3sxi5y-elon-musk-to-joe-rogan-george-soros-fundamentally-hates-humanity.html
~ Two minutes.
https://rumble.com/v3sxaml-elon-musk-tells-joe-rogan-the-real-reason-he-bought-twitter-its-mind-blowin.html
~ Five minutes.
https://rumble.com/v3sxg5x-elon-musk-explains-to-joe-rogan-why-hospitals-ventilating-patients-killed-t.html
Notice it is the 1970s AGAIN…
Glenn Reynolds: Why we still don’t have flying carsAfter regulation exploded in 1970, innovation hit a sustained speed bump.